Install Graphite and Grafana Ubuntu 16.04
Related topics:
- Install Graphite and Grafana on Ubuntu 16.04
- Install Grafana on Ubuntu 18.04
- Install Grafana on Ubuntu 20.04
Why is this guide not ported to Ubuntu 18.04?
At my latest tests the package graphite-web was broken and Apache run into Python errors. I will update the tutorial as soon as I know a (non docker based!) workaround for this issues.
In this tutorial I'm going to use MySQL as database for Graphite and Whisper files as database for the performance data.
Most people use PostgreSQL as database for Graphite, but I'm more familiar with MySQL...
As web server I'm using Apache. If you like to mess around with things, you can also use Nginx.
All commands needs to run as user root or via sudo.
Install Graphite
First of all, we need to install some dependencies
apt-get install graphite-web graphite-carbon mysql-server python-mysqldb python-pymysql apache2 libapache2-mod-wsgi apt-transport-https ssl-cert
Create a MySQL User and Database for Graphite
As already mentioned, I'm using MySQL to store Graphite metadata.
CREATE USER 'graphite'@'localhost' IDENTIFIED BY 'password';
CREATE DATABASE IF NOT EXISTS `graphite` DEFAULT CHARACTER SET utf8 DEFAULT COLLATE utf8_general_ci;
GRANT ALL PRIVILEGES ON `graphite`.* TO 'graphite'@'localhost';
Now edit the following values in the file /etc/graphite/local_settings.py.
The SECRET_KEY is use as salt, whenever graphite is going to hash something. Set something unique as value.
For example the output of the command uuidgen or so.
SECRET_KEY = 'UNSAFE_DEFAULT'
Set the Timezone of your monitoring nodes.
TIME_ZONE = 'Europe/Berlin'
In the last set, we need to configure the MySQL database connection
DATABASES = {
    'default': {
        'NAME': 'graphite',
        'ENGINE': 'django.db.backends.mysql',
        'USER': 'graphite',
        'PASSWORD': 'password',
        'HOST': '127.0.0.1',
        'PORT': '3306',
        'STORAGE_ENGINE': 'INNODB'
    }
}
Graphite comes with a tool, to create the database schema automatically. All you need to do is, run the following command:
graphite-manage syncdb
If you run into the error django.db.utils.IntegrityError: (1215, u'Cannot add foreign key constraint') just try
again to run the command graphite-manage syncdb
Now open the file /etc/default/graphite-carbon and change the value to true
to enable carbon cache on boot.
CARBON_CACHE_ENABLED=true
Configure Storage Time
Copy the following content to the file /etc/carbon/storage-schemas.conf
to store all values prefixed with statusengine for 90 days.
[statusengine]
pattern = ^statusengine\.
retentions = 60:90d
If you change these values later, you need to delete the Whisper files. For more information please go to the Carbon documentation.
For example:
[statusengine]
pattern = ^statusengine\.
retentions = 60:90d

[carbon]
pattern = ^carbon\.
retentions = 60:90d

[default_1min_for_1day]
pattern = .*
retentions = 60s:1d
Now you can launch your Graphite instance.
systemctl start carbon-cache
Enable Graphite Web
a2dissite 000-default
cp /usr/share/graphite-web/apache2-graphite.conf /etc/apache2/sites-available
Move Graphite Web to port 8888
In this case, we don't want to use the Graphite Web. We just need the TCP API and the HTTP API provided by Graphite.
Open the file /etc/apache2/sites-available/apache2-graphite.conf and change the port to 8888:
<VirtualHost *:8888>
Now add the port 8888 to the Apache Config file /etc/apache2/ports.conf:
Listen 80
Listen 8888

<IfModule ssl_module>
        Listen 443
</IfModule>

<IfModule mod_gnutls.c>
        Listen 443
</IfModule>
a2ensite apache2-graphite
systemctl restart apache2
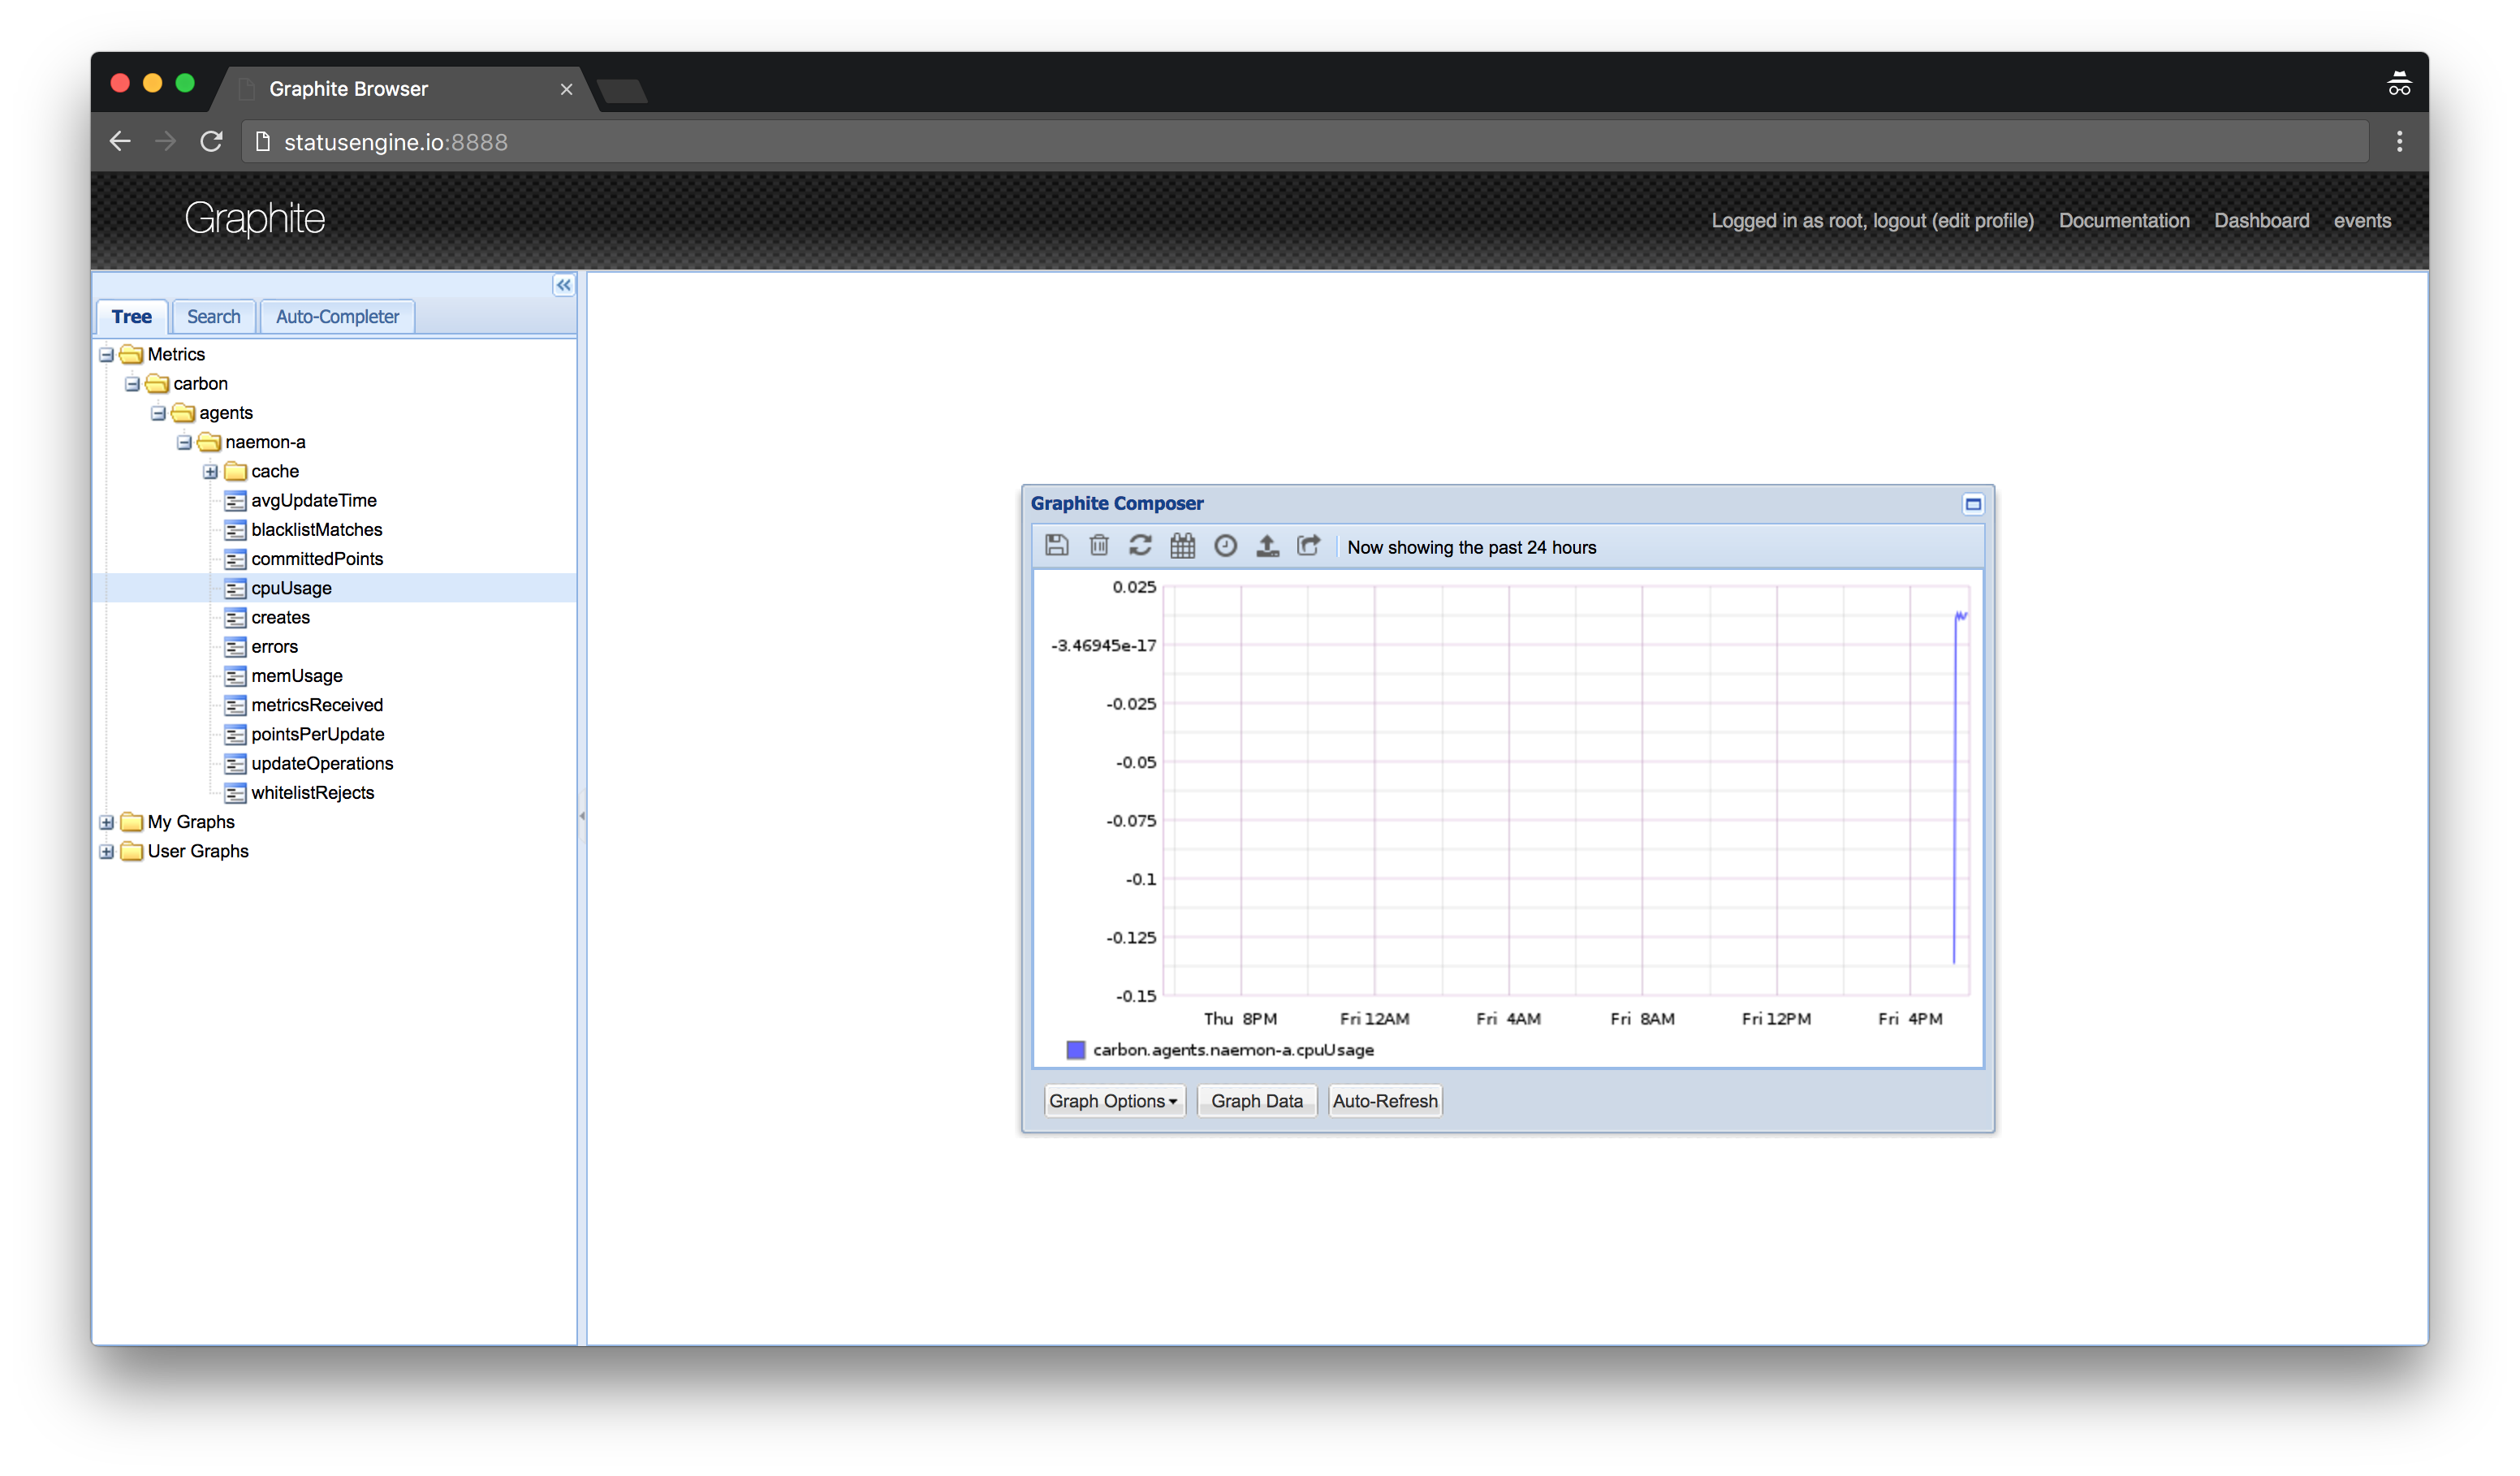
Now you should able to browse to the Graphite Web via http://your-address:8888
Install Grafana
Before you start! Please take a look at the official documentation! http://docs.grafana.org/installation/debian/
echo "deb https://packagecloud.io/grafana/stable/debian/ jessie main" > /etc/apt/sources.list.d/grafana.list
curl https://packagecloud.io/gpg.key | apt-key add -
apt-get update
apt-get install grafana

systemctl daemon-reload
systemctl start grafana-server
systemctl enable grafana-server
Configure Apache as reverse proxy for Grafana
Create the file /etc/apache2/sites-available/apache2-grafana.conf with the following content:
<VirtualHost *:80>
    ServerName statusengine.org

    RewriteEngine On
    RewriteCond %{HTTPS} off
    RewriteRule (.*) https://%{SERVER_NAME}/$1 [R,L]
</VirtualHost>

<VirtualHost *:443>
    ProxyPreserveHost On
    ProxyPass / http://127.0.0.1:3000/
    ProxyPassReverse / http://127.0.0.1:3000/

    SSLEngine On
    SSLCertificateFile /etc/ssl/certs/ssl-cert-snakeoil.pem
    SSLCertificateKeyFile /etc/ssl/private/ssl-cert-snakeoil.key
</VirtualHost>
Notice: We added an automatically redirect from http to https using self-signed certificates.
Enable the new configuration
a2ensite apache2-grafana
a2enmod proxy
a2enmod proxy_http
a2enmod ssl
a2enmod xml2enc
a2enmod rewrite
systemctl restart apache2
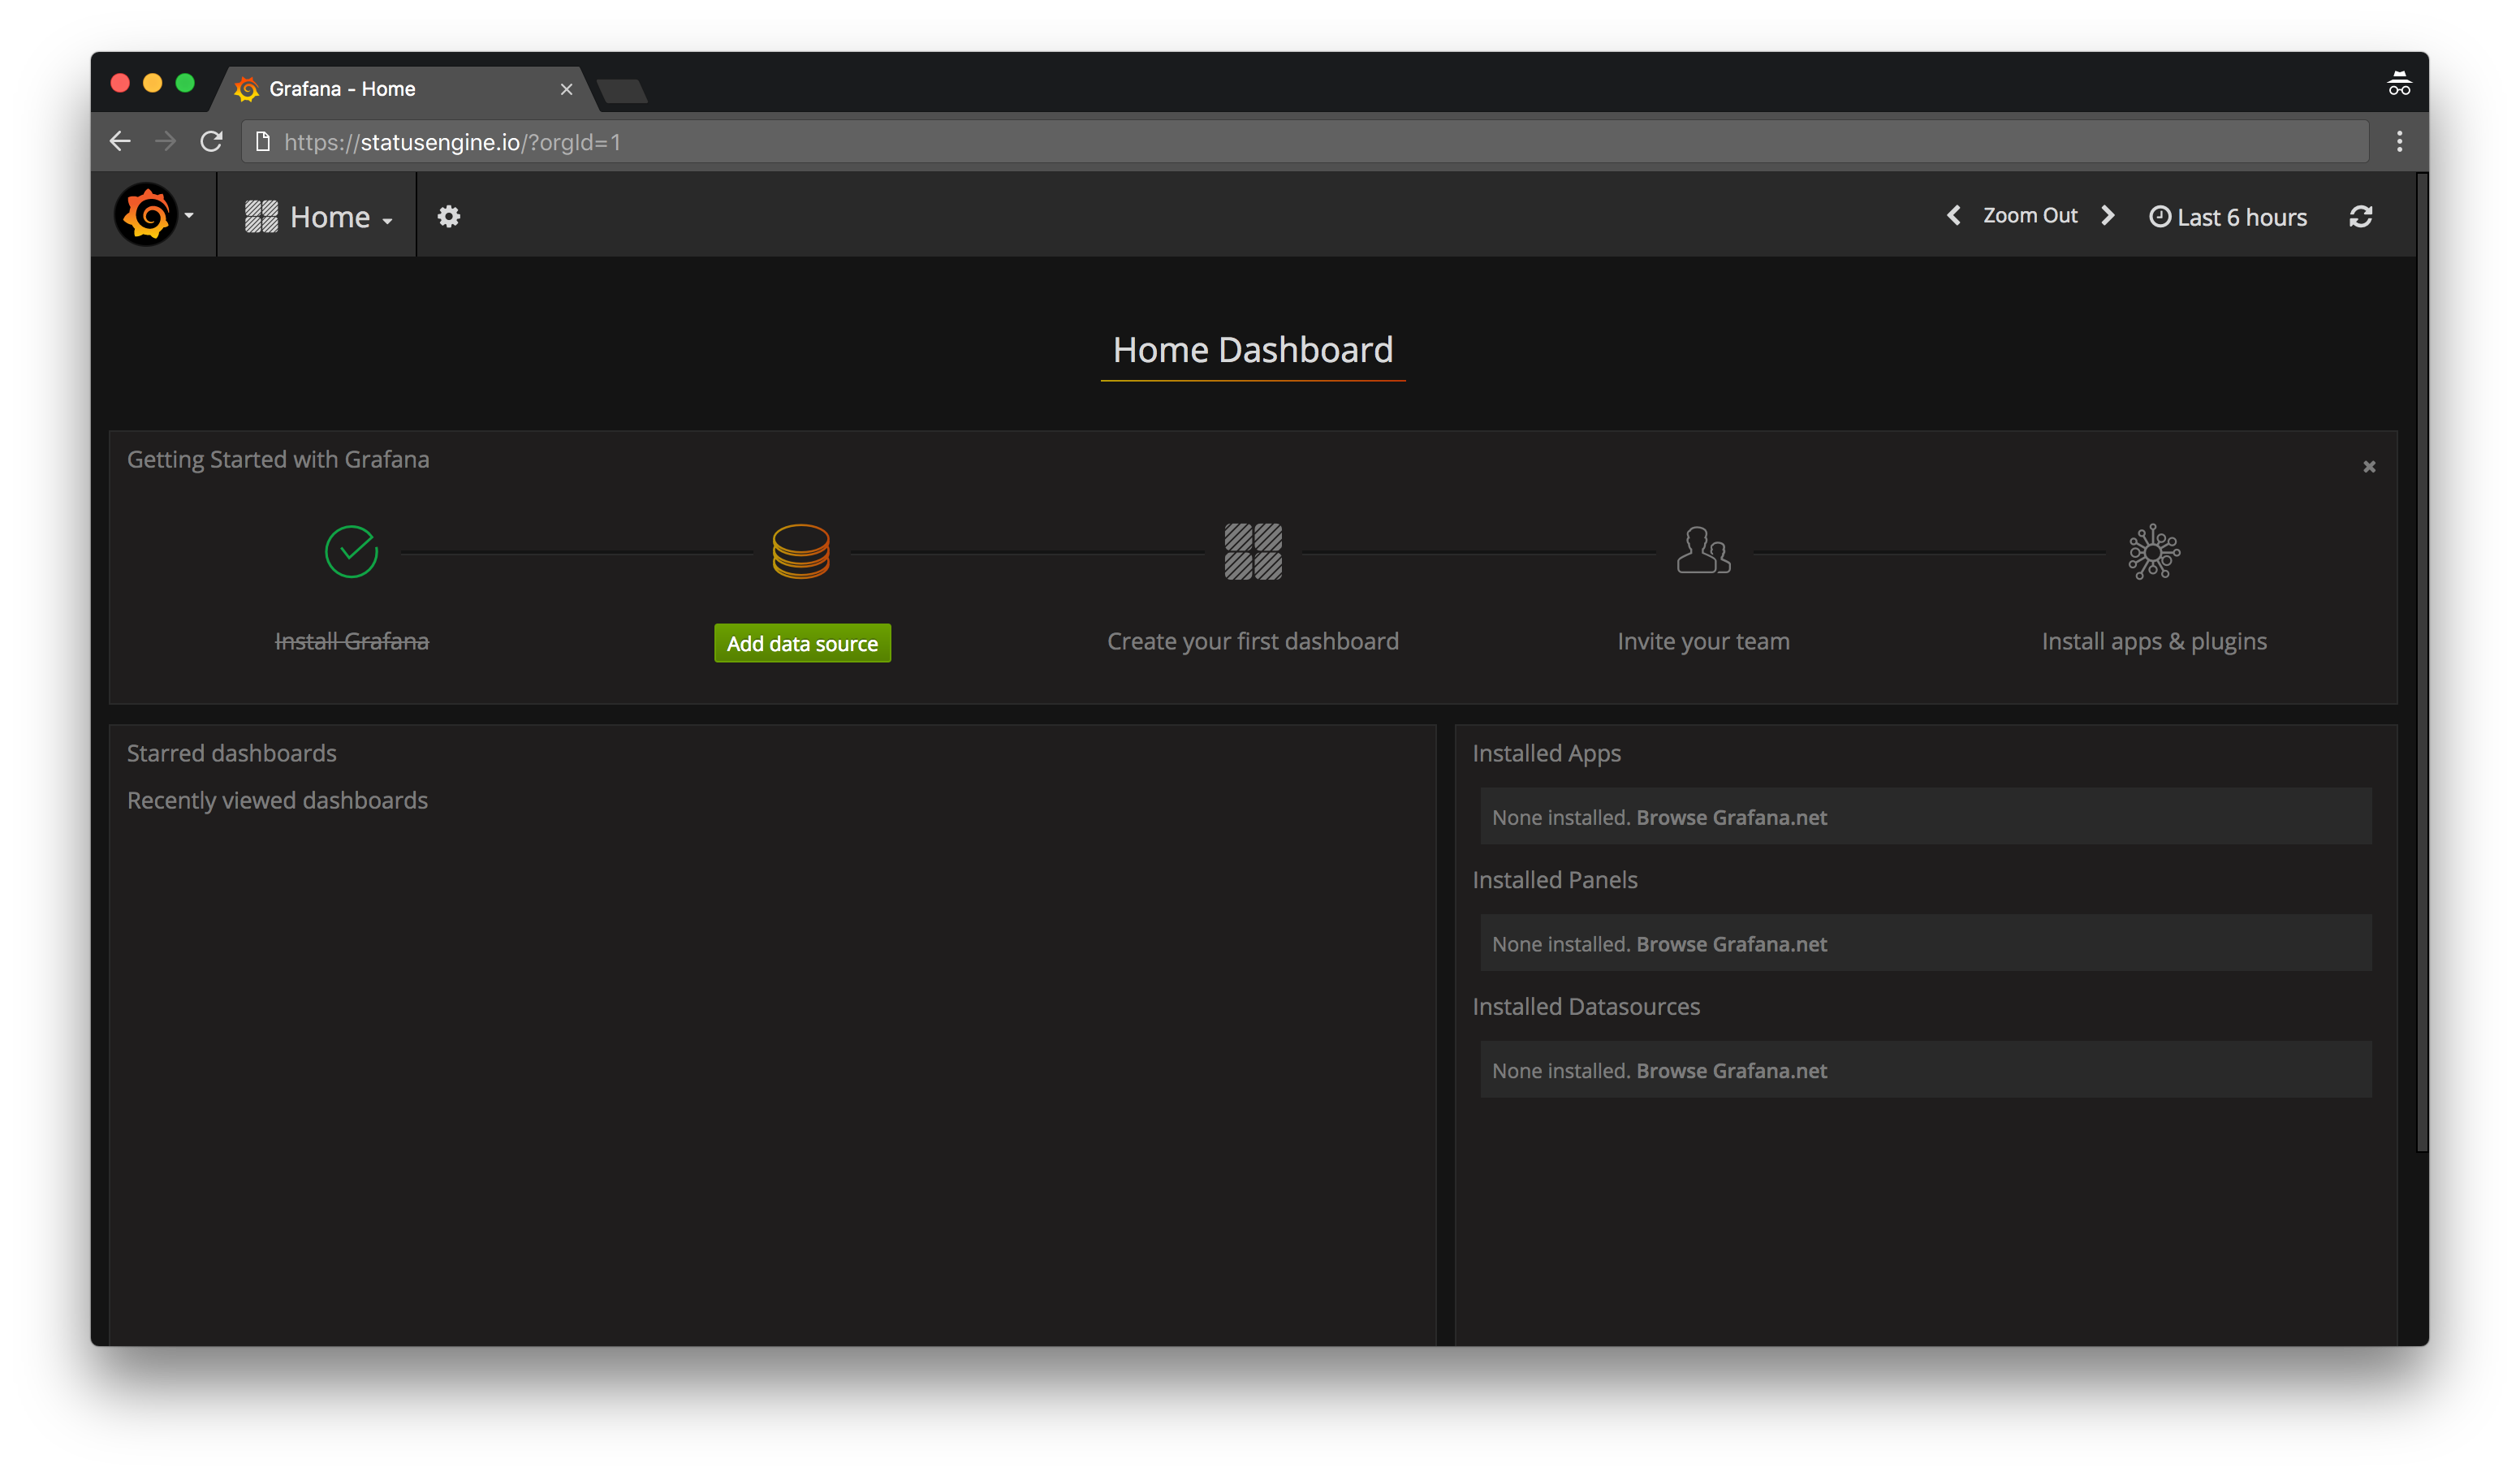
Now you should able to browse to the Grafana Frontend via https://your-address.
Username: admin
Password: admin
The Grafana configuration is located at /etc/grafana/grafana.ini. I would recommend
you to take a look at this file.
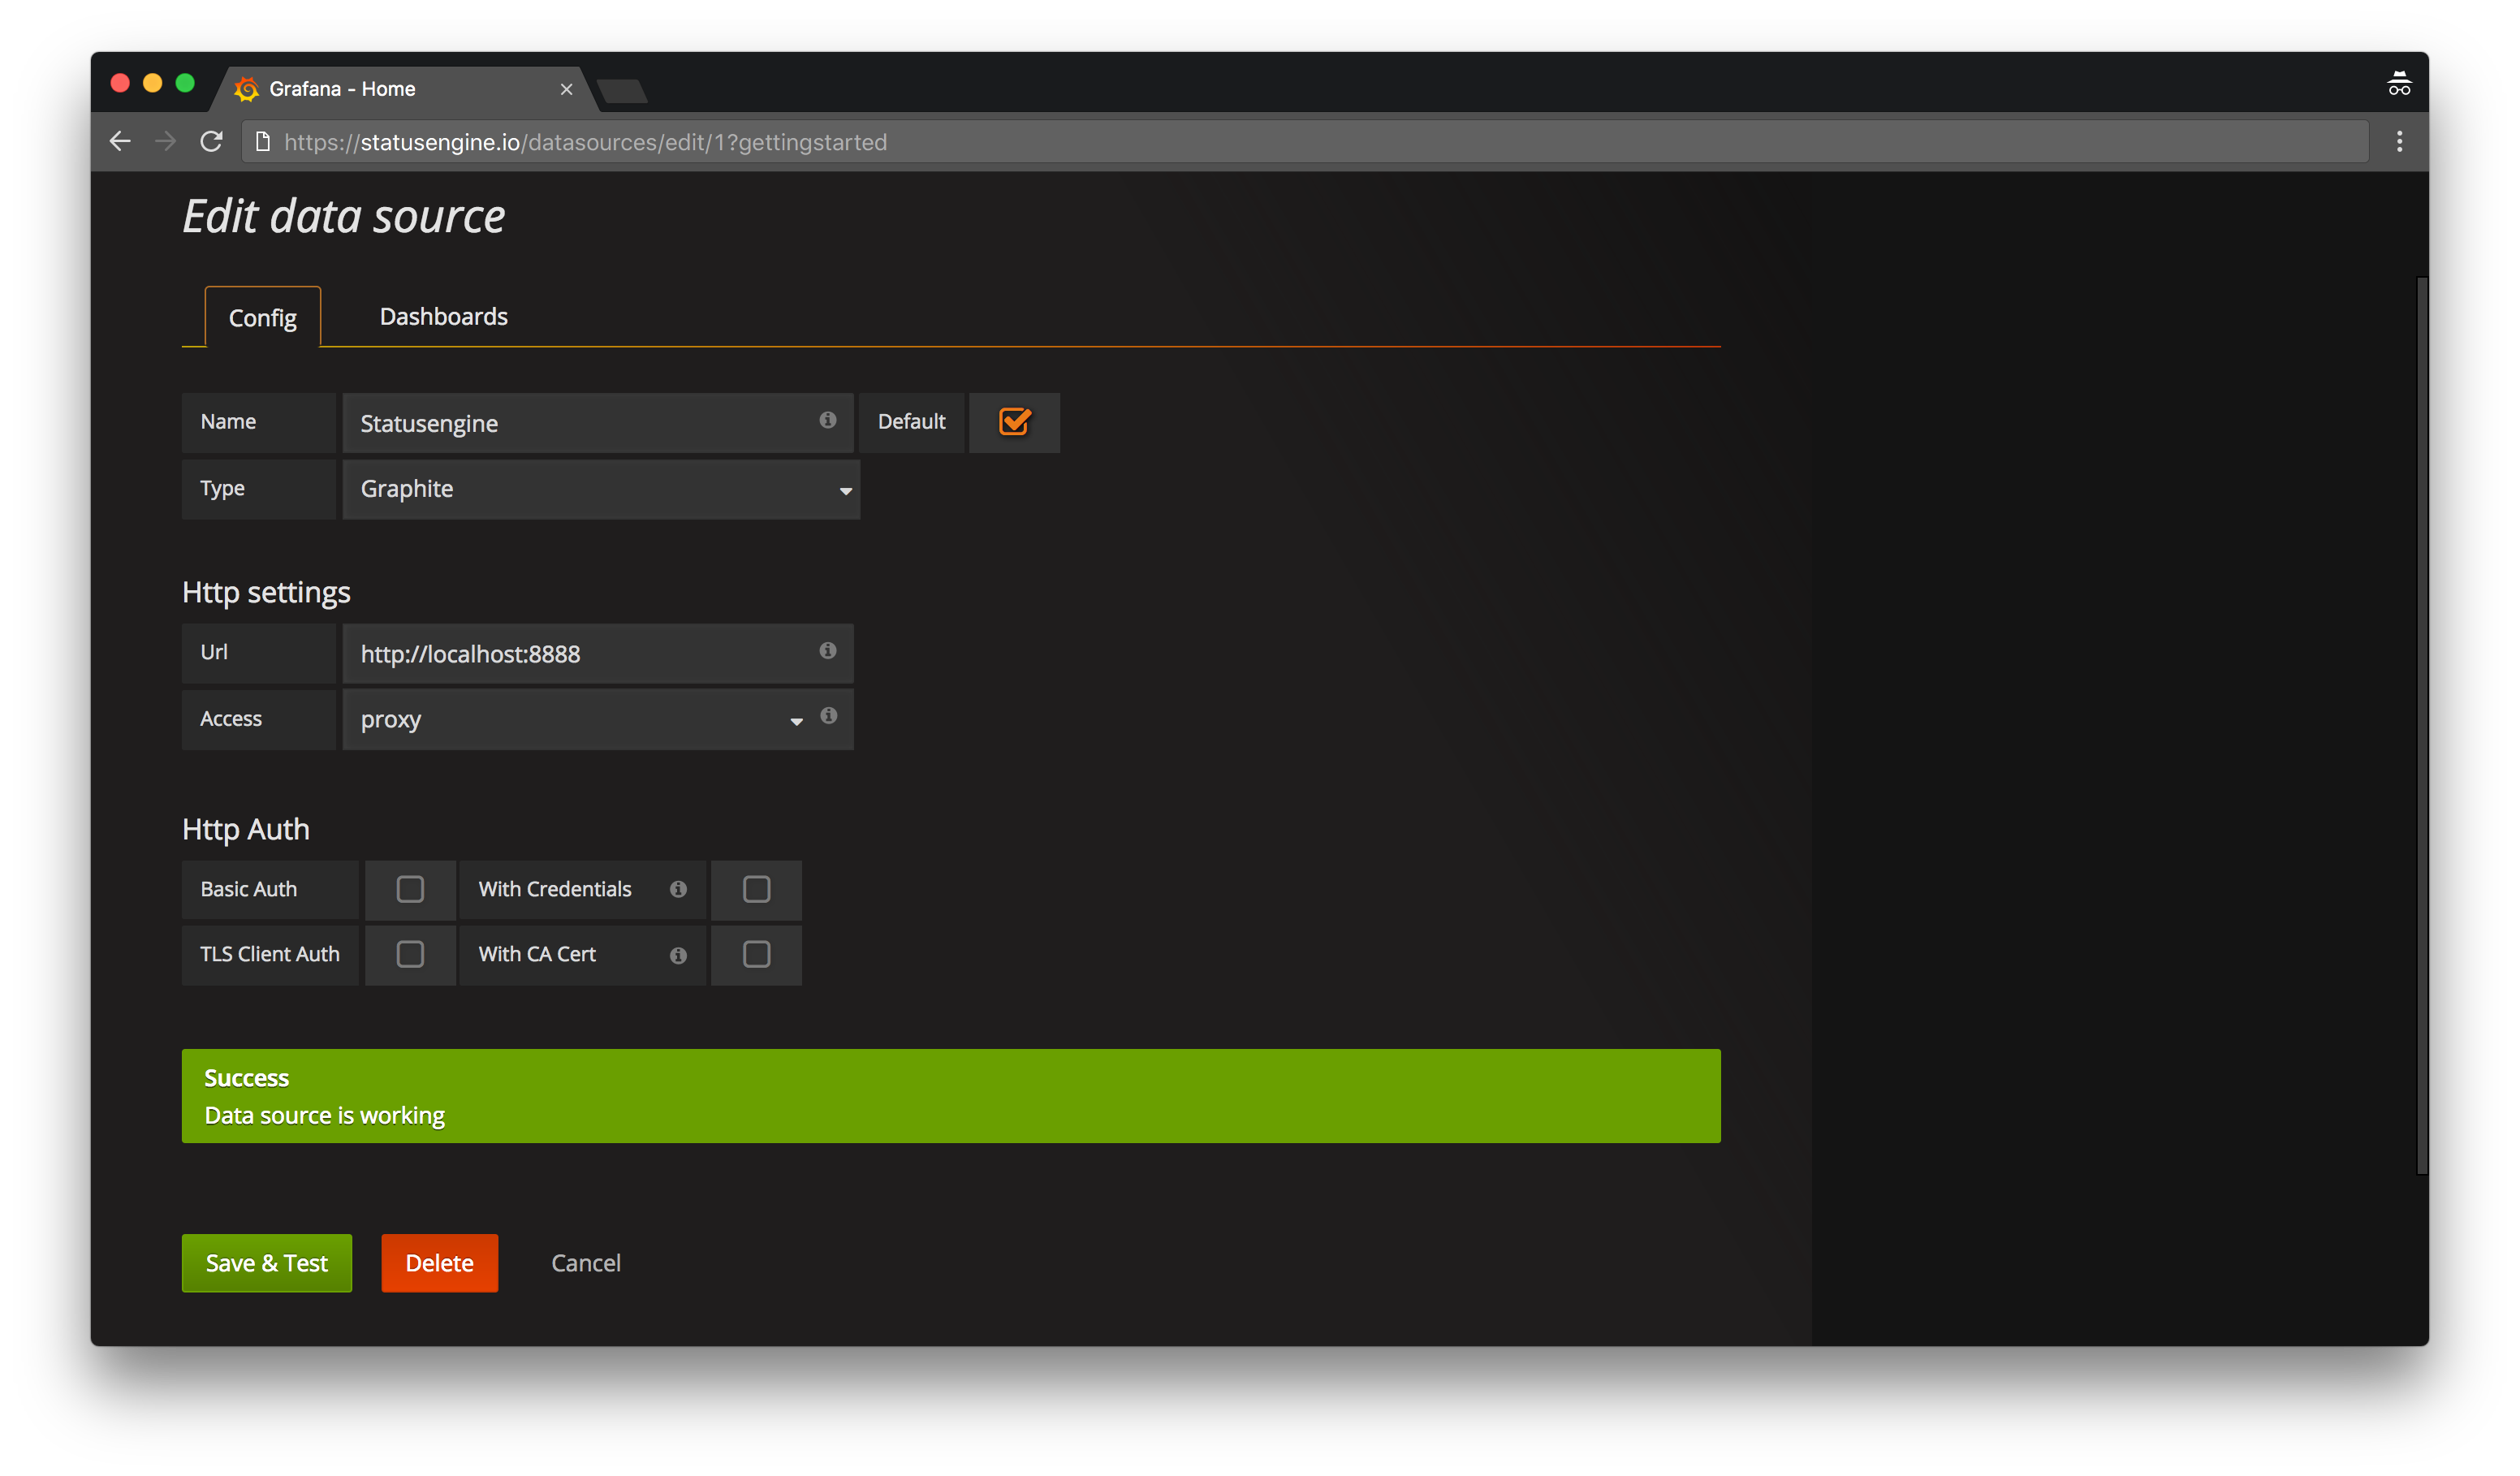
Add Graphite as Datasource in Grafana
Configure Statusengine Worker to save Performance data to Graphite
Add your new Graphite instance to your Statusengine Worker Config in /opt/statusengine/worker/etc/config.yml
Statusengine Worker use the "plaintext protocol", an TCP connection to save metrics to Graphite.
Remember to change the IP Address!
process_perfdata: 1

number_perfdata_worker: 1

perfdata_backend:
# - crate
 - graphite
# - mysql

graphite_prefix: statusengine

graphite_address: 192.168.56.106

graphite_port: 2003
To enable the ne settings, restart Statusengine Worker
systemctl restart statusengine
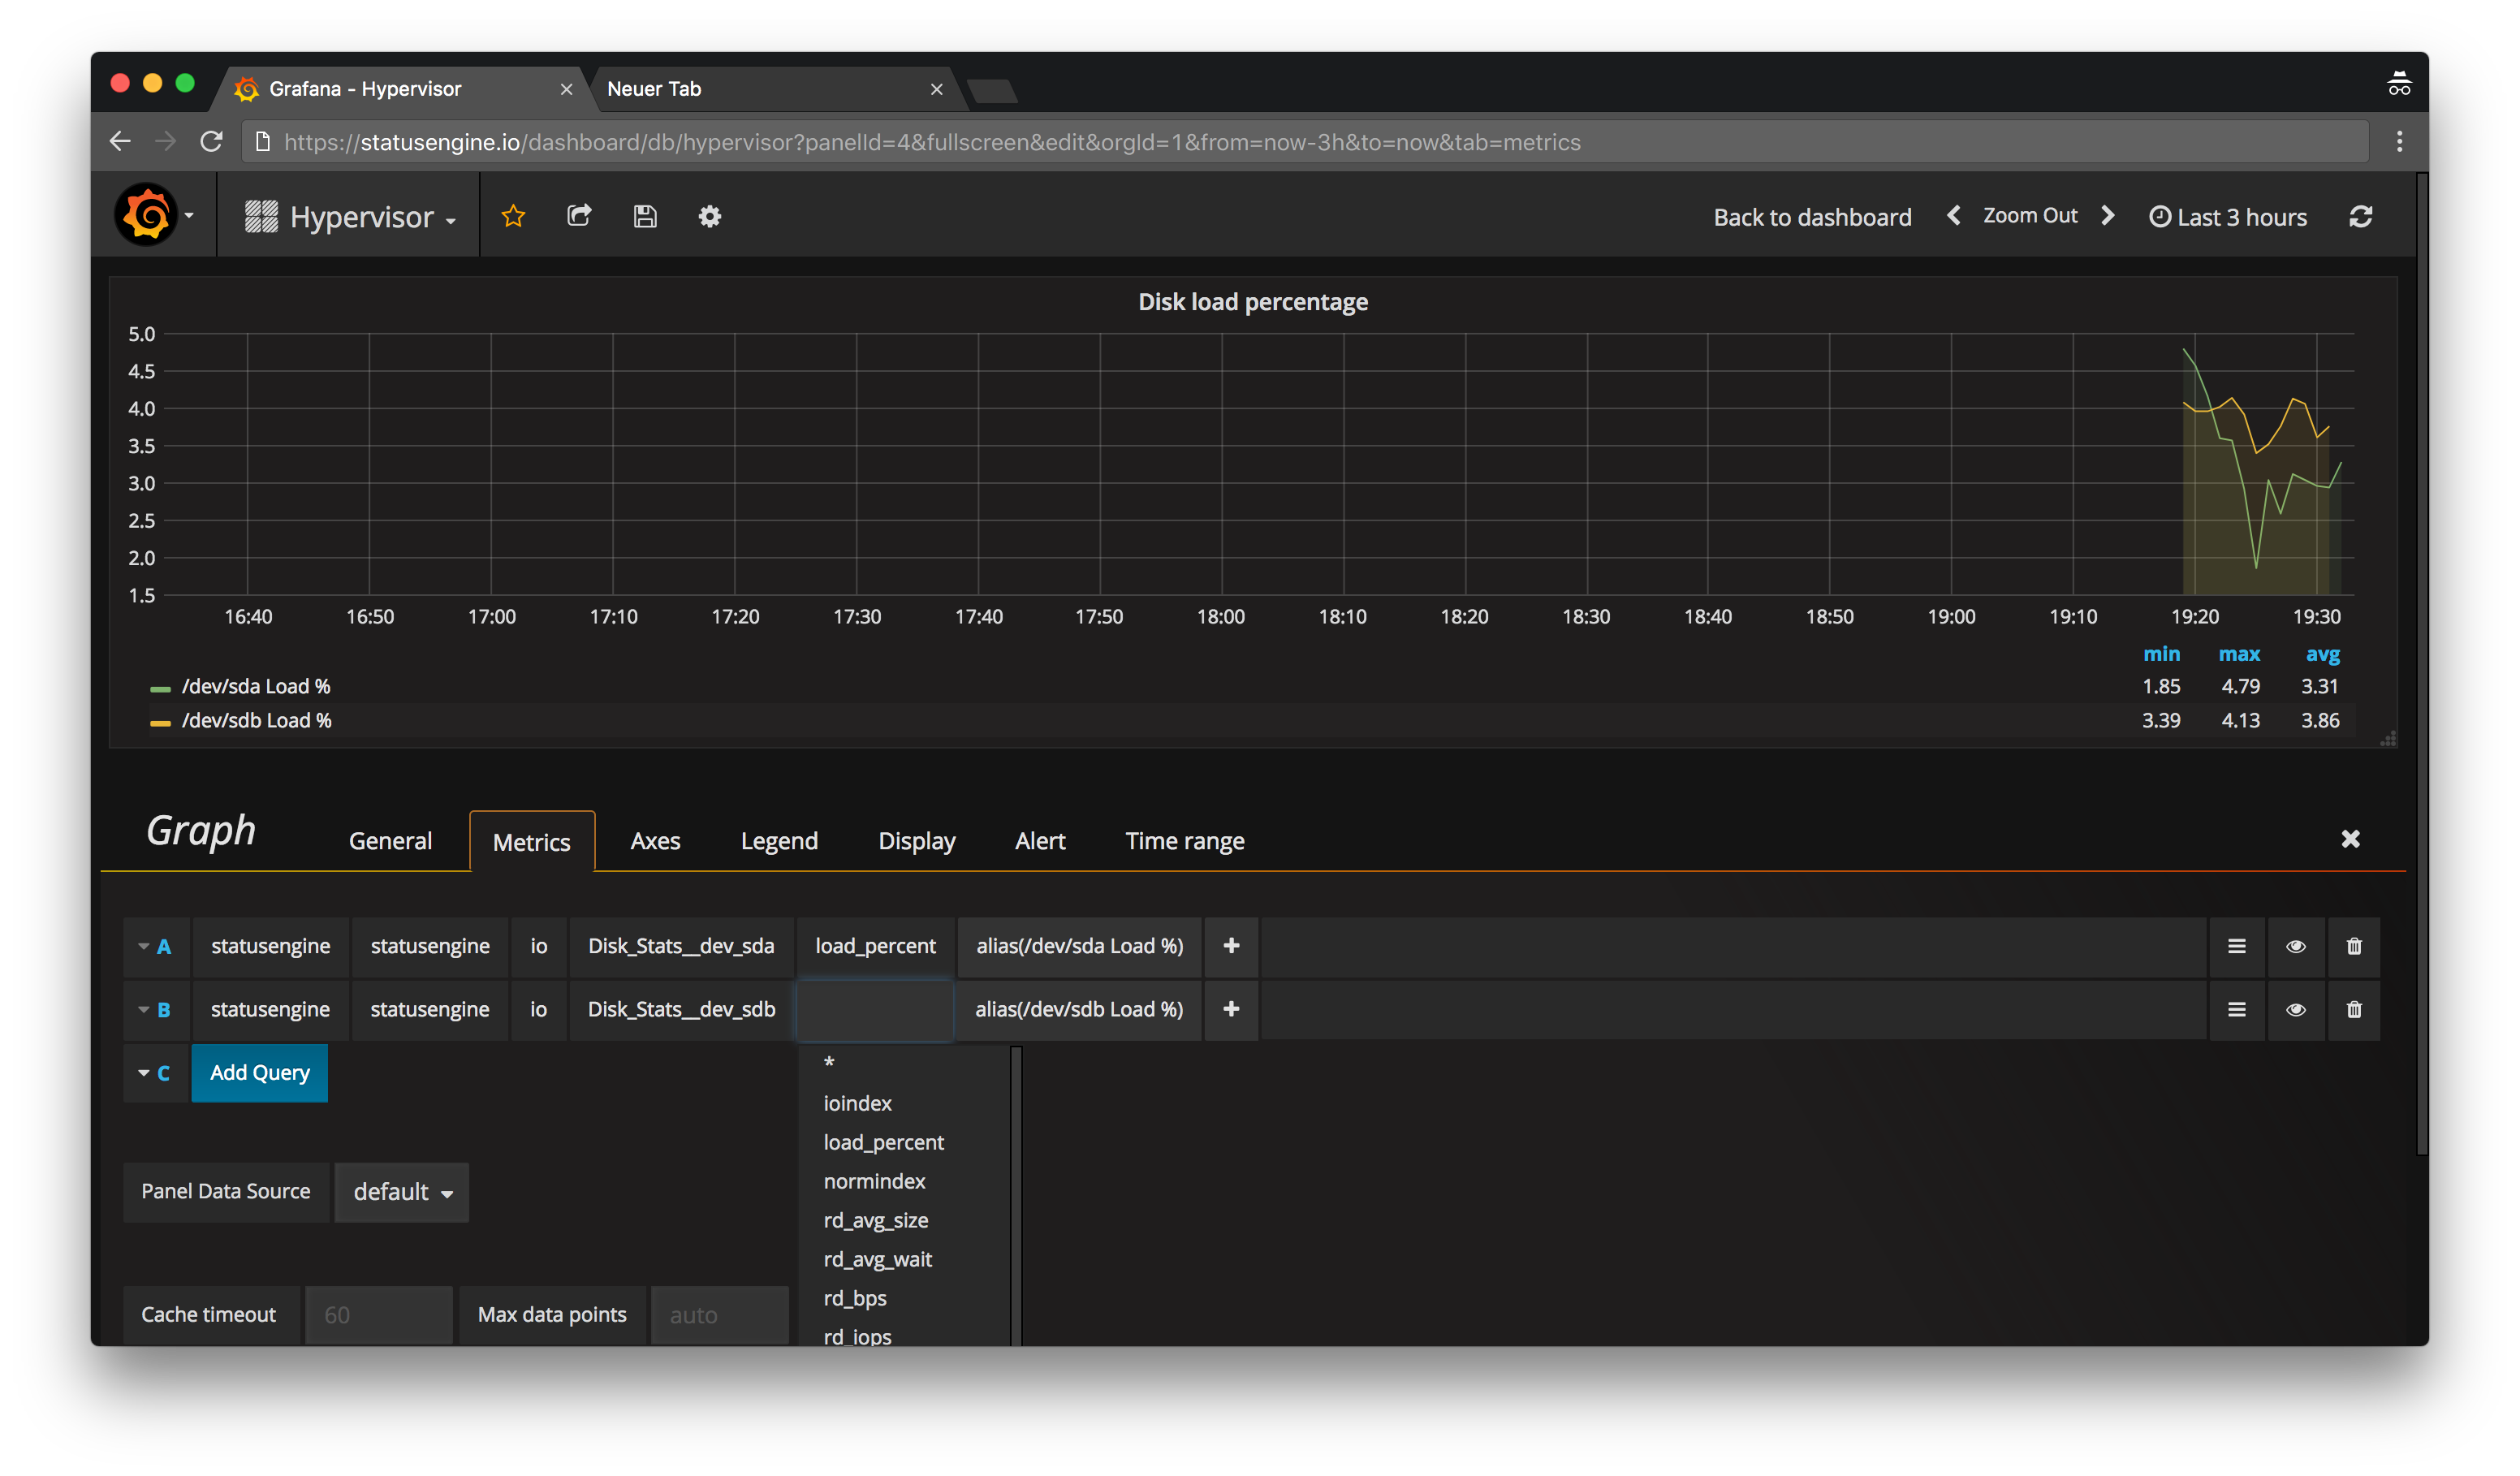
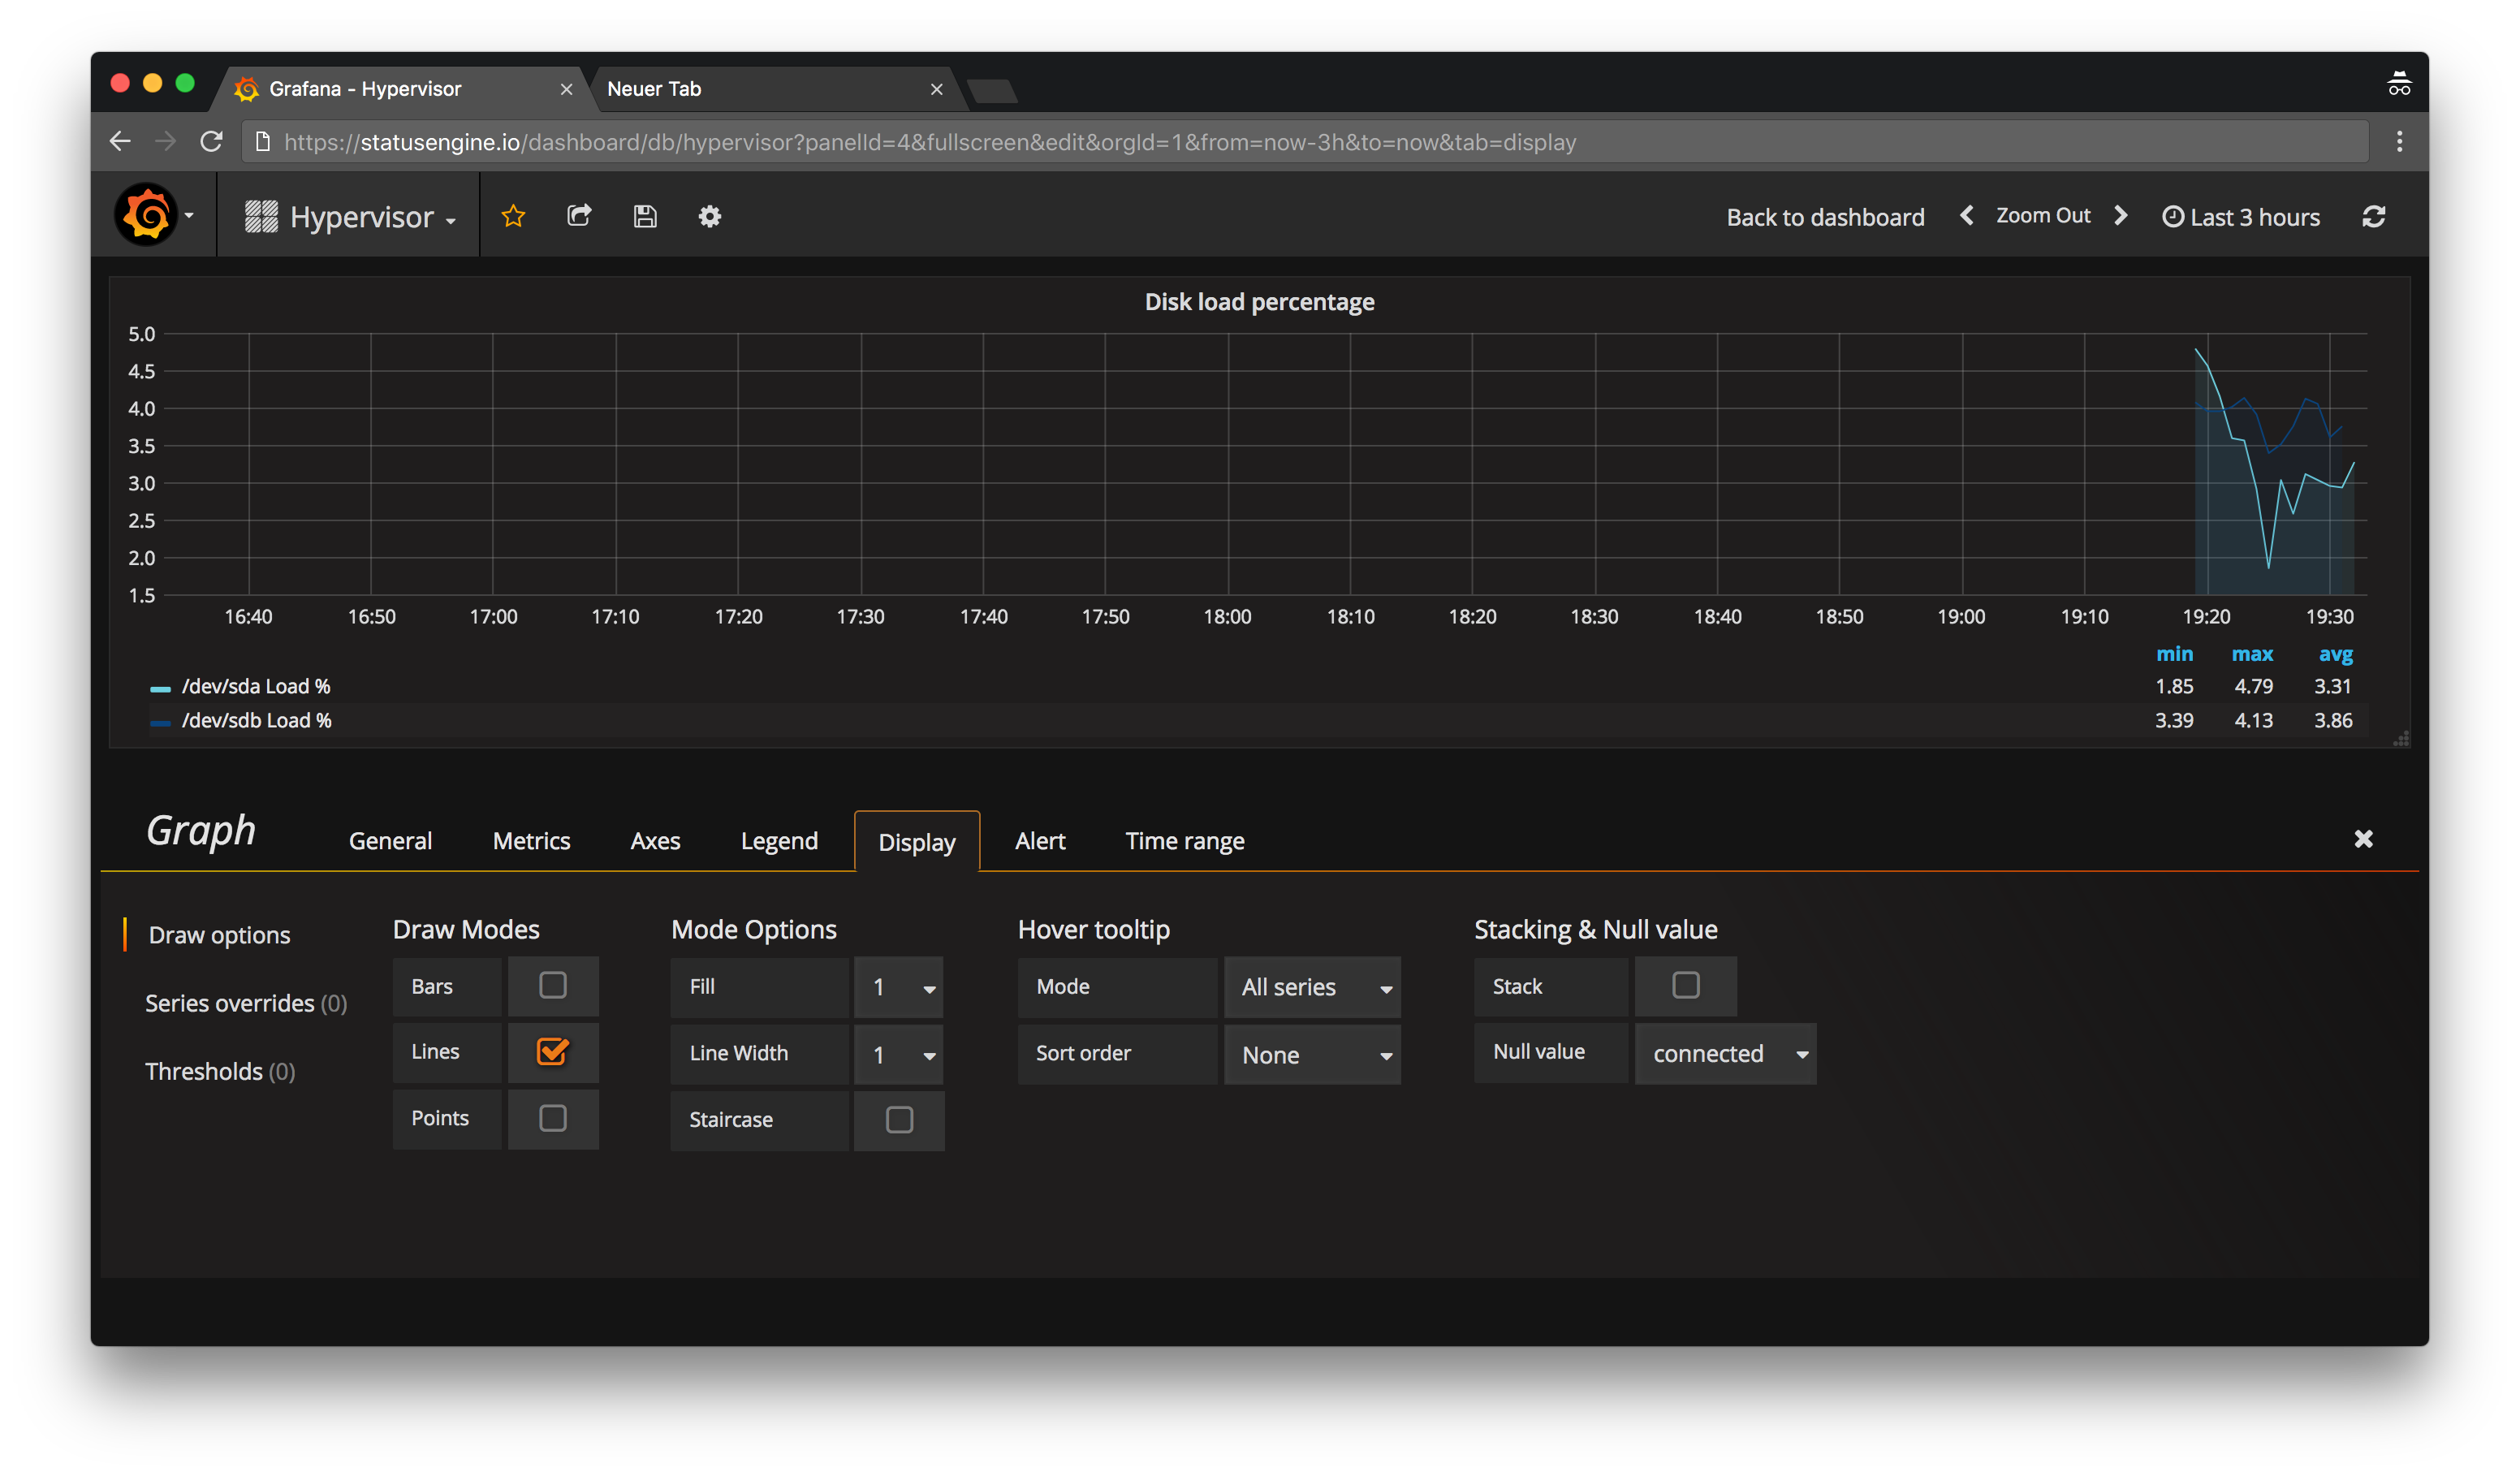
Create your first Grafana Dashboard
Now you can create the first Graph in Grafana. Thanks to the Grafana UI this is super easy.
If you have gaps in your Graphs, set Null value to connected
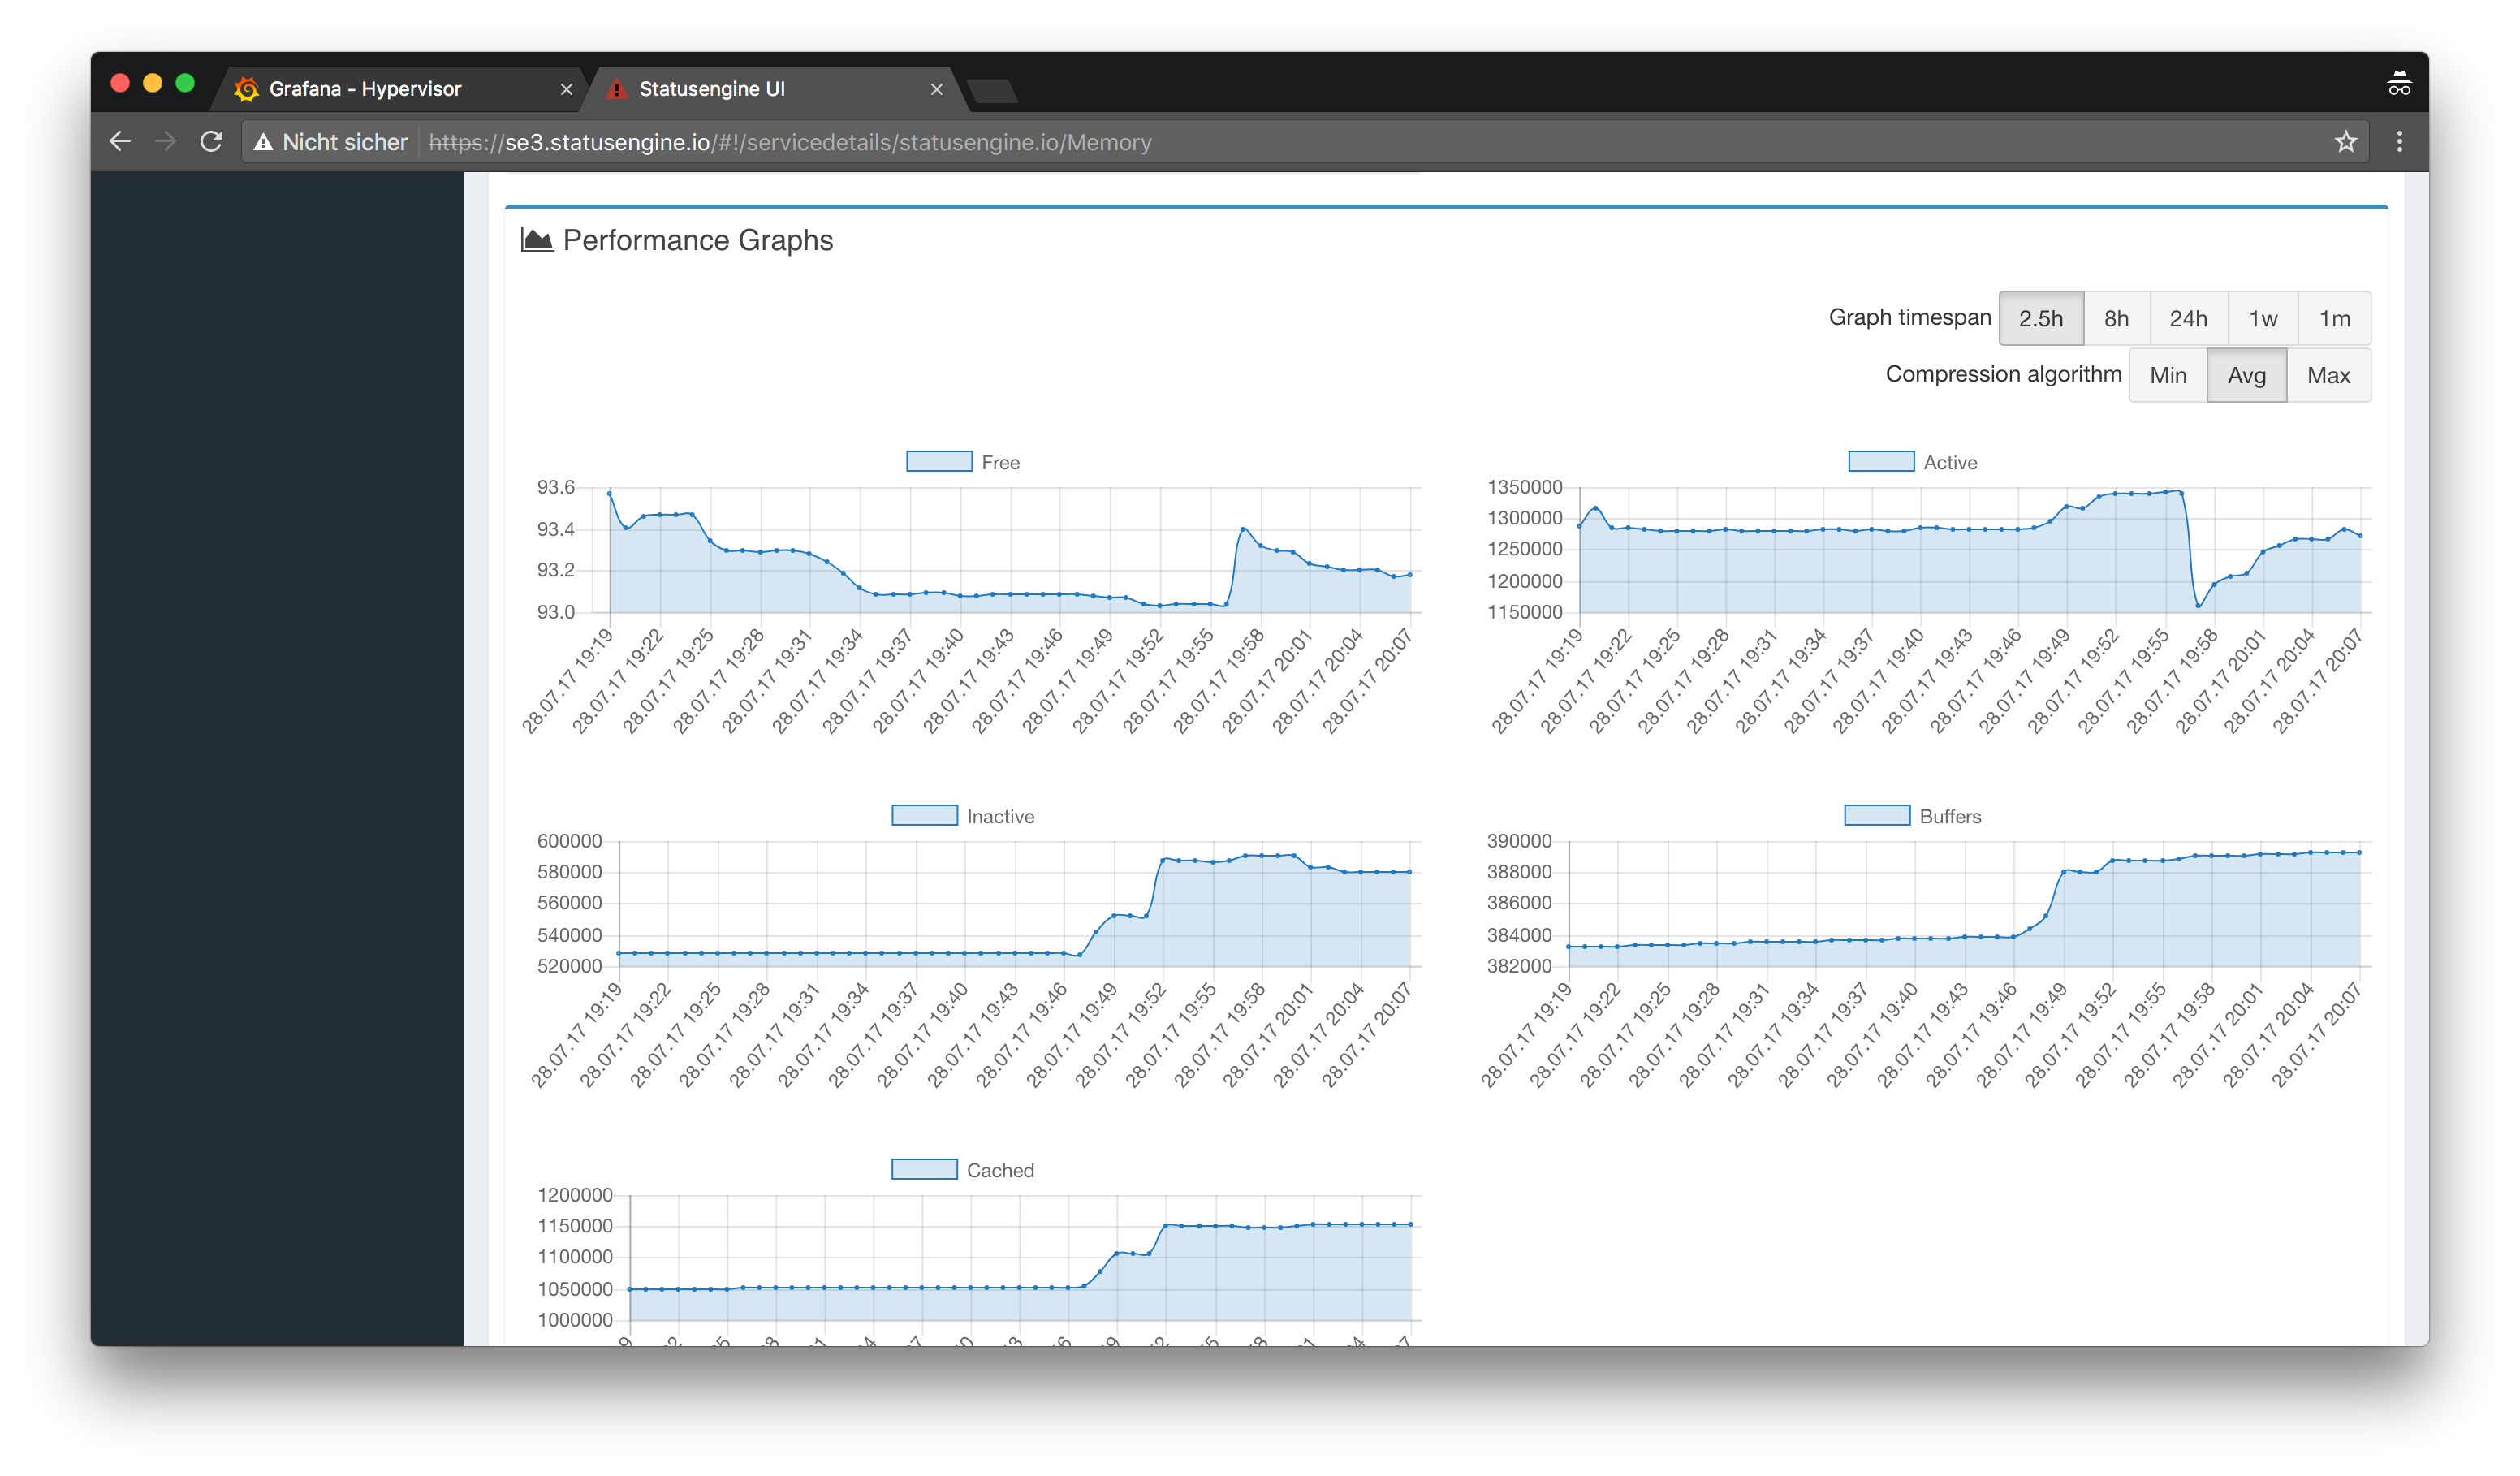
Configure Statusengine Ui to load Performance data from Graphite
In the last step you need to enable Graphite as Performance Data Backend for
Statusengine Ui. Open the file /usr/share/statusengine-ui/etc/config.yml and
change the following values.
Remember to change the IP Address!
display_perfdata: 1

# Uncomment to enable
# CrateDB as Performance Data Backend
# CrateDB is the default at the moment
#perfdata_backend: crate

# Graphite as Performance Data Backend
perfdata_backend: graphite

# MySQL as Performance Data Backend
#perfdata_backend: mysql

graphite_prefix: statusengine

graphite_url: http://192.168.56.106:8888

graphite_use_basic_auth: 0

graphite_user: graphite

graphite_password: password

graphite_allow_self_signed_certificates: 0
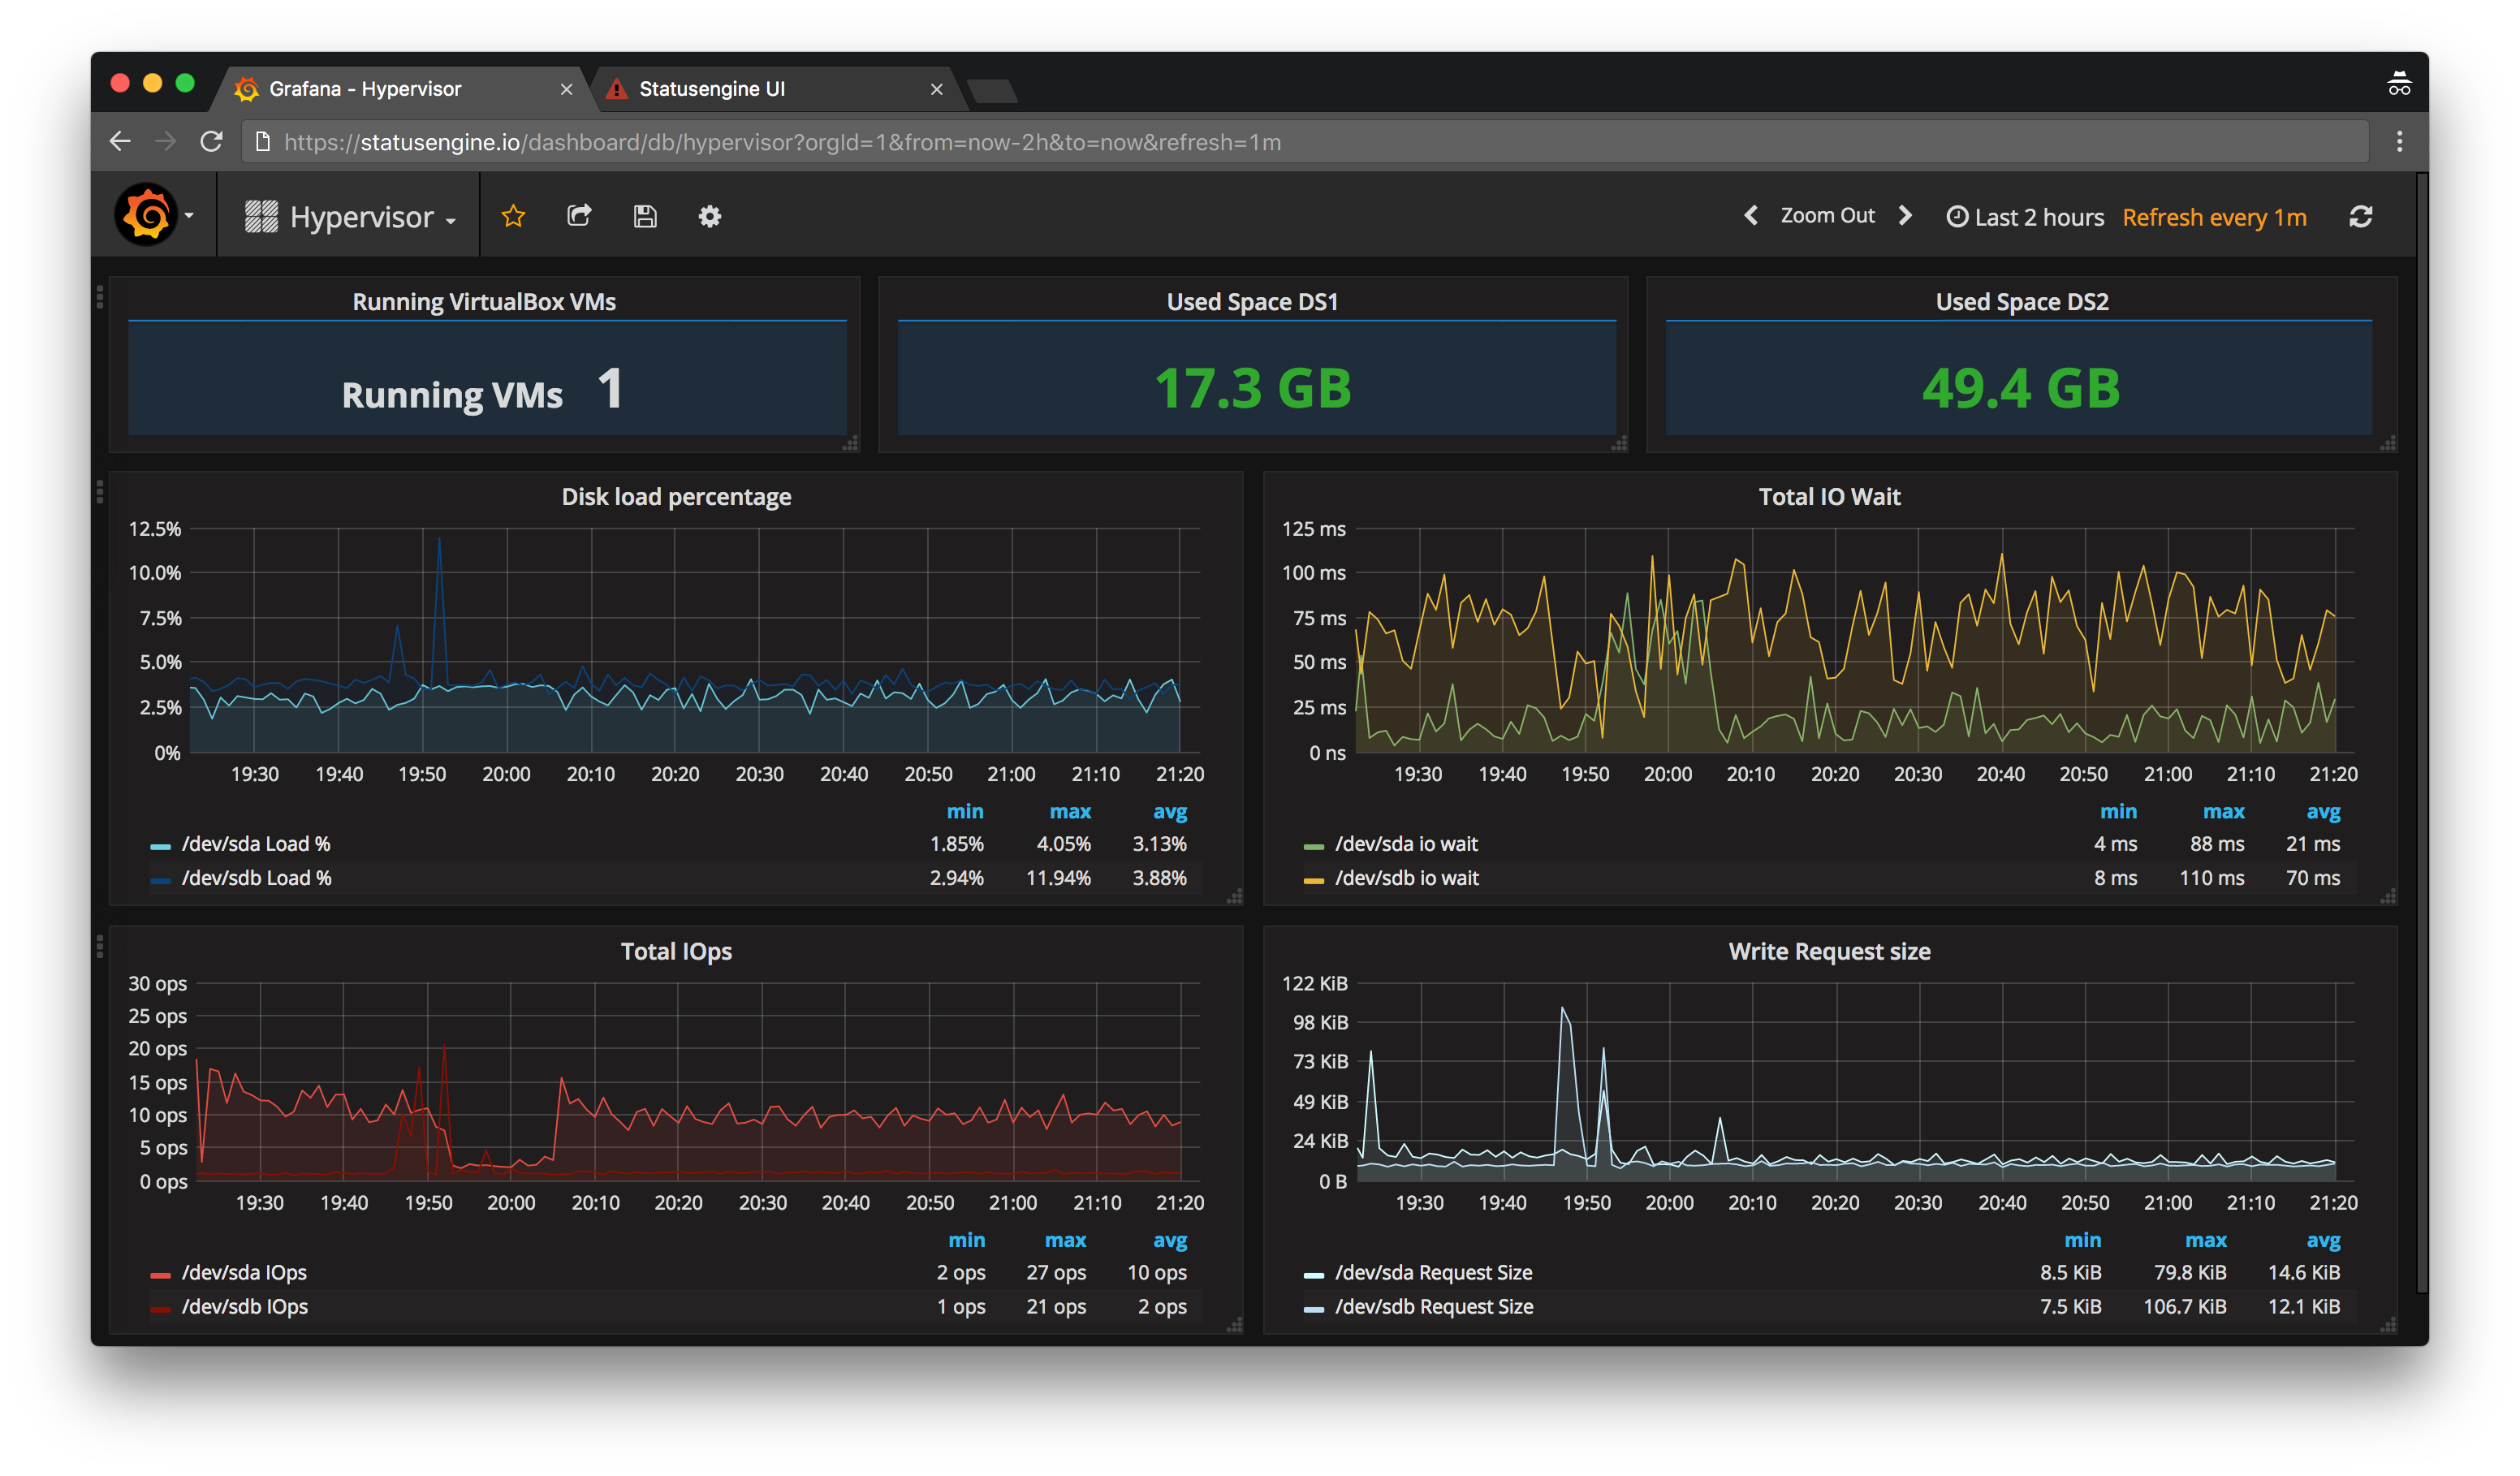
Play around
I recommend you to play around with Grafana and get in touch if you are new to it.
This is an example Dashboard I created:
Delete old records from Whisper
Graphite uses Carbon/Whisper to store the performance data.
You want to delete old records, just rm the files from:
/var/lib/graphite/whisper