You are reading the documentation for Statusengine 3.x - Switch to Version 2.x for old stable
Install Grafana Ubuntu 20.04
Install Grafana
Related topics:
- Install Graphite and Grafana on Ubuntu 16.04
- Install Grafana on Ubuntu 18.04
- Install Grafana on Ubuntu 20.04
Before you start! Please take a look at the official documentation! http://docs.grafana.org/installation/debian/
apt-get install apt-transport-https

echo "deb https://packages.grafana.com/oss/deb stable main" > /etc/apt/sources.list.d/grafana.list
curl https://packages.grafana.com/gpg.key | apt-key add -
apt-get update

apt-get install grafana

systemctl daemon-reload
systemctl start grafana-server
systemctl enable grafana-server
Configure Apache as reverse proxy for Grafana (optional)
apt-get install apache2 ssl-cert
Create the file /etc/apache2/sites-available/apache2-grafana.conf with the following content:
<VirtualHost *:80>
    ServerName statusengine.org

    RewriteEngine On
    RewriteCond %{HTTPS} off
    RewriteRule (.*) https://%{SERVER_NAME}/$1 [R,L]
</VirtualHost>

<VirtualHost *:443>
    ProxyPreserveHost On
    ProxyPass / http://127.0.0.1:3000/
    ProxyPassReverse / http://127.0.0.1:3000/

    SSLEngine On
    SSLCertificateFile /etc/ssl/certs/ssl-cert-snakeoil.pem
    SSLCertificateKeyFile /etc/ssl/private/ssl-cert-snakeoil.key
</VirtualHost>
Notice: We added an automatically redirect from http to https using self-signed certificates.
Enable the new configuration
a2ensite apache2-grafana
a2enmod proxy
a2enmod proxy_http
a2enmod ssl
a2enmod xml2enc
a2enmod rewrite
systemctl restart apache2
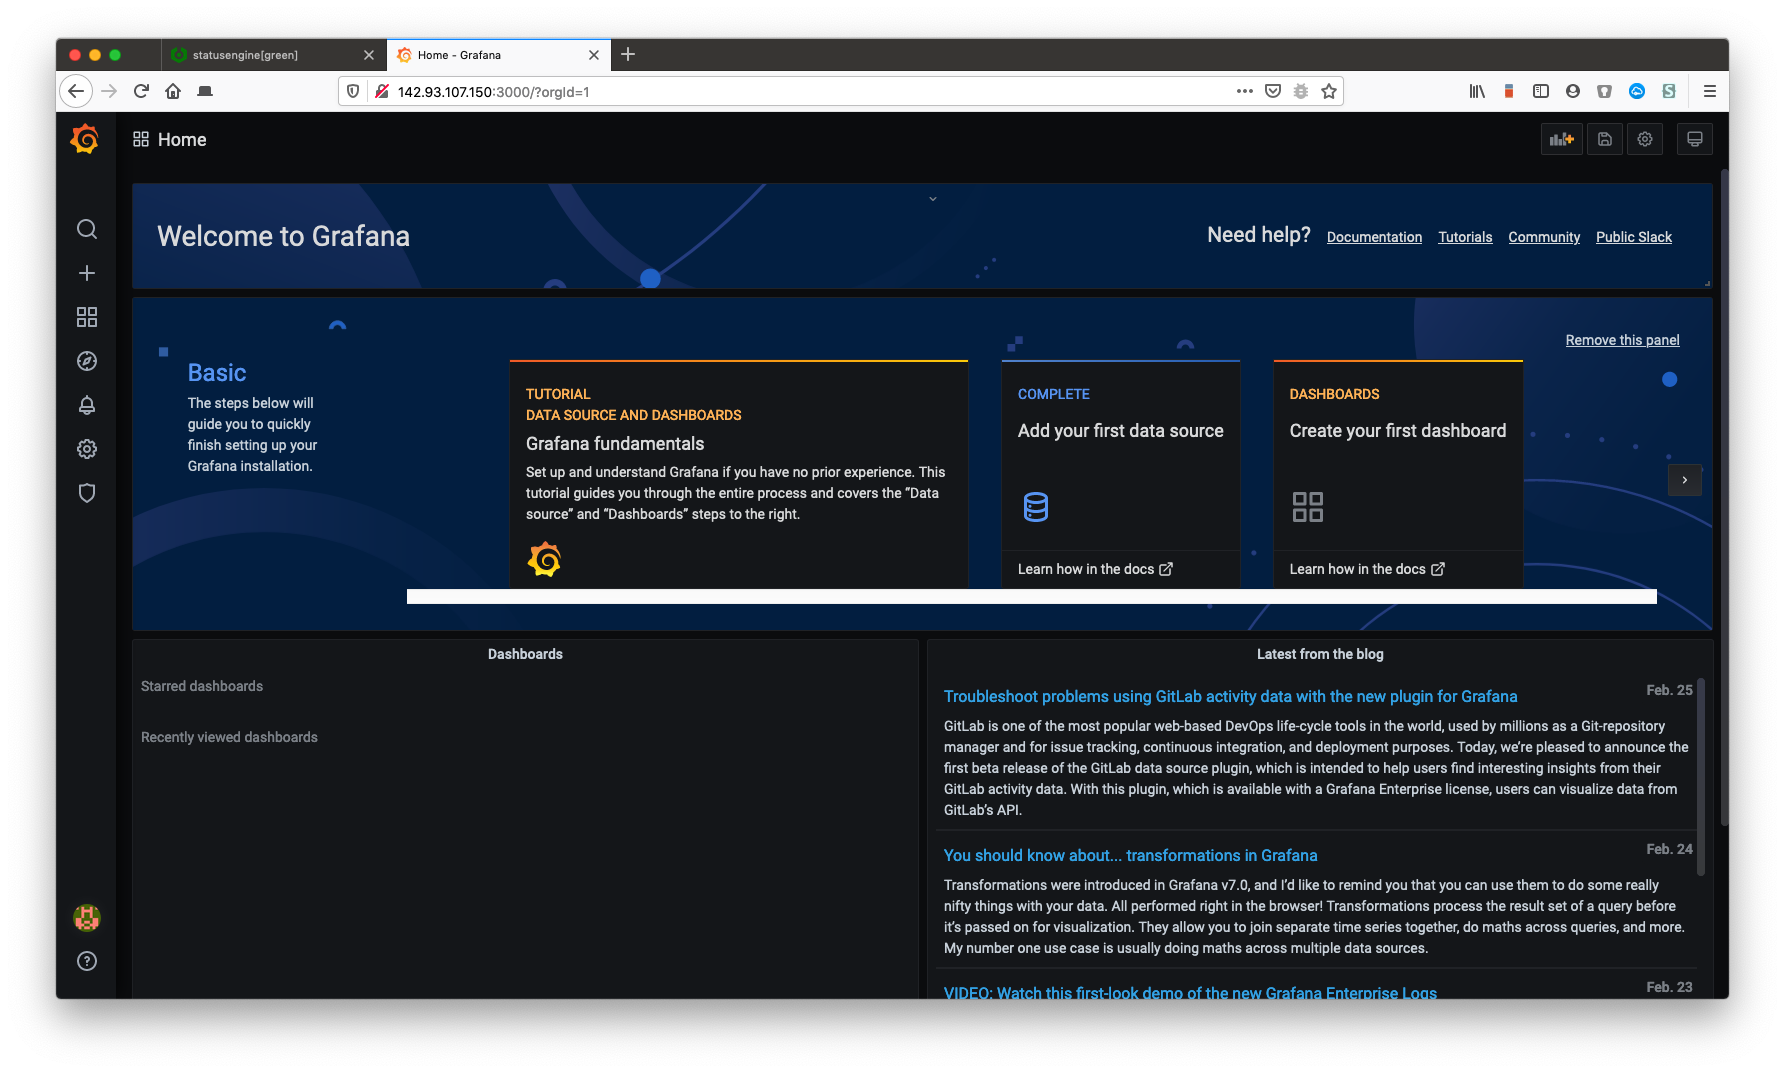
Now you should able to browse to the Grafana Frontend via https://your-address.
Username: admin
Password: admin
The Grafana configuration is located at /etc/grafana/grafana.ini. I would recommend
you to take a look at this file.
Add Datasource for Statusengine
This tutorial is basically made for the Statusengine project. To continue, decide which storage backend you prefer to store metric data.