Getting Started
Overview
As already mentioned on the landing page, Statusengine
is a modular piece of software to save Naemon and Nagios event data to a database.
The main goal is, to reduce your toolstack and enable your monitoring, to
scale horizontally.
Components
Broker Module
This little C++ program gets loaded to your Monitoring Core. It will encode every event as JSON object and send it to a queue.
Worker
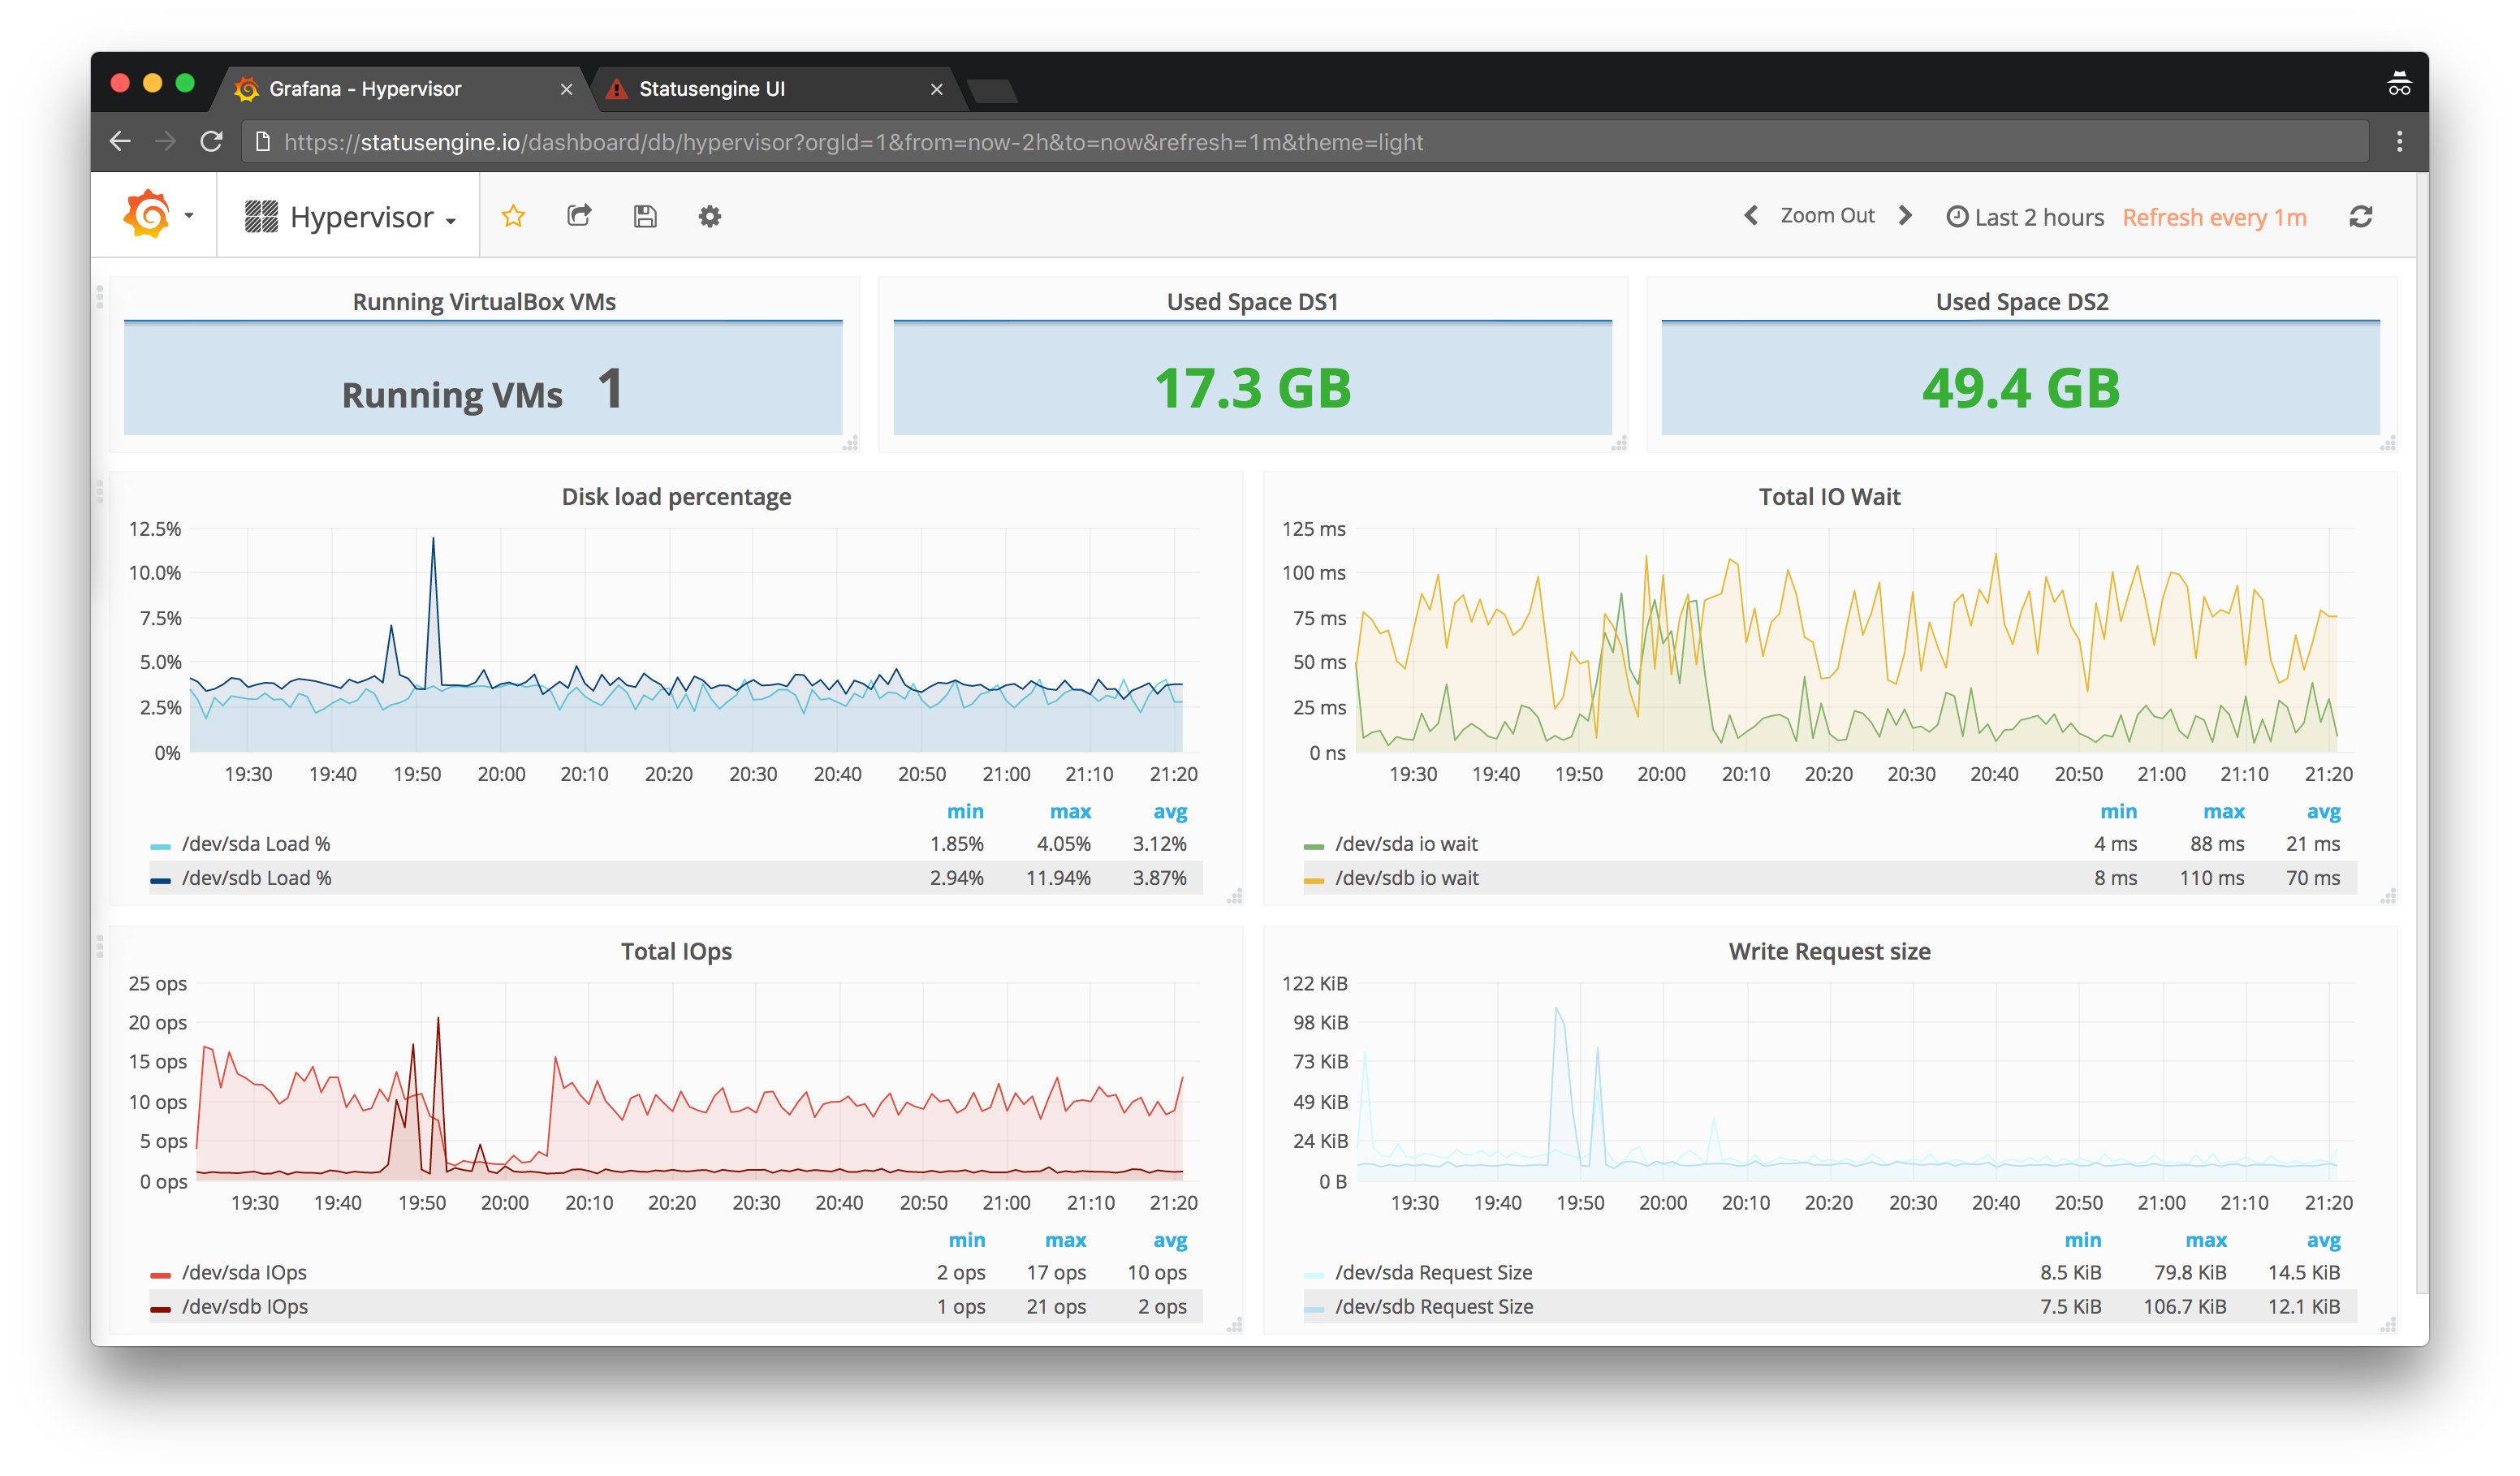
A PHP process that fetch all events out of the queue and save them to a database. In addition this process will also process performance data to build beautiful dashboards using Grafana for example.
Statusengine UI
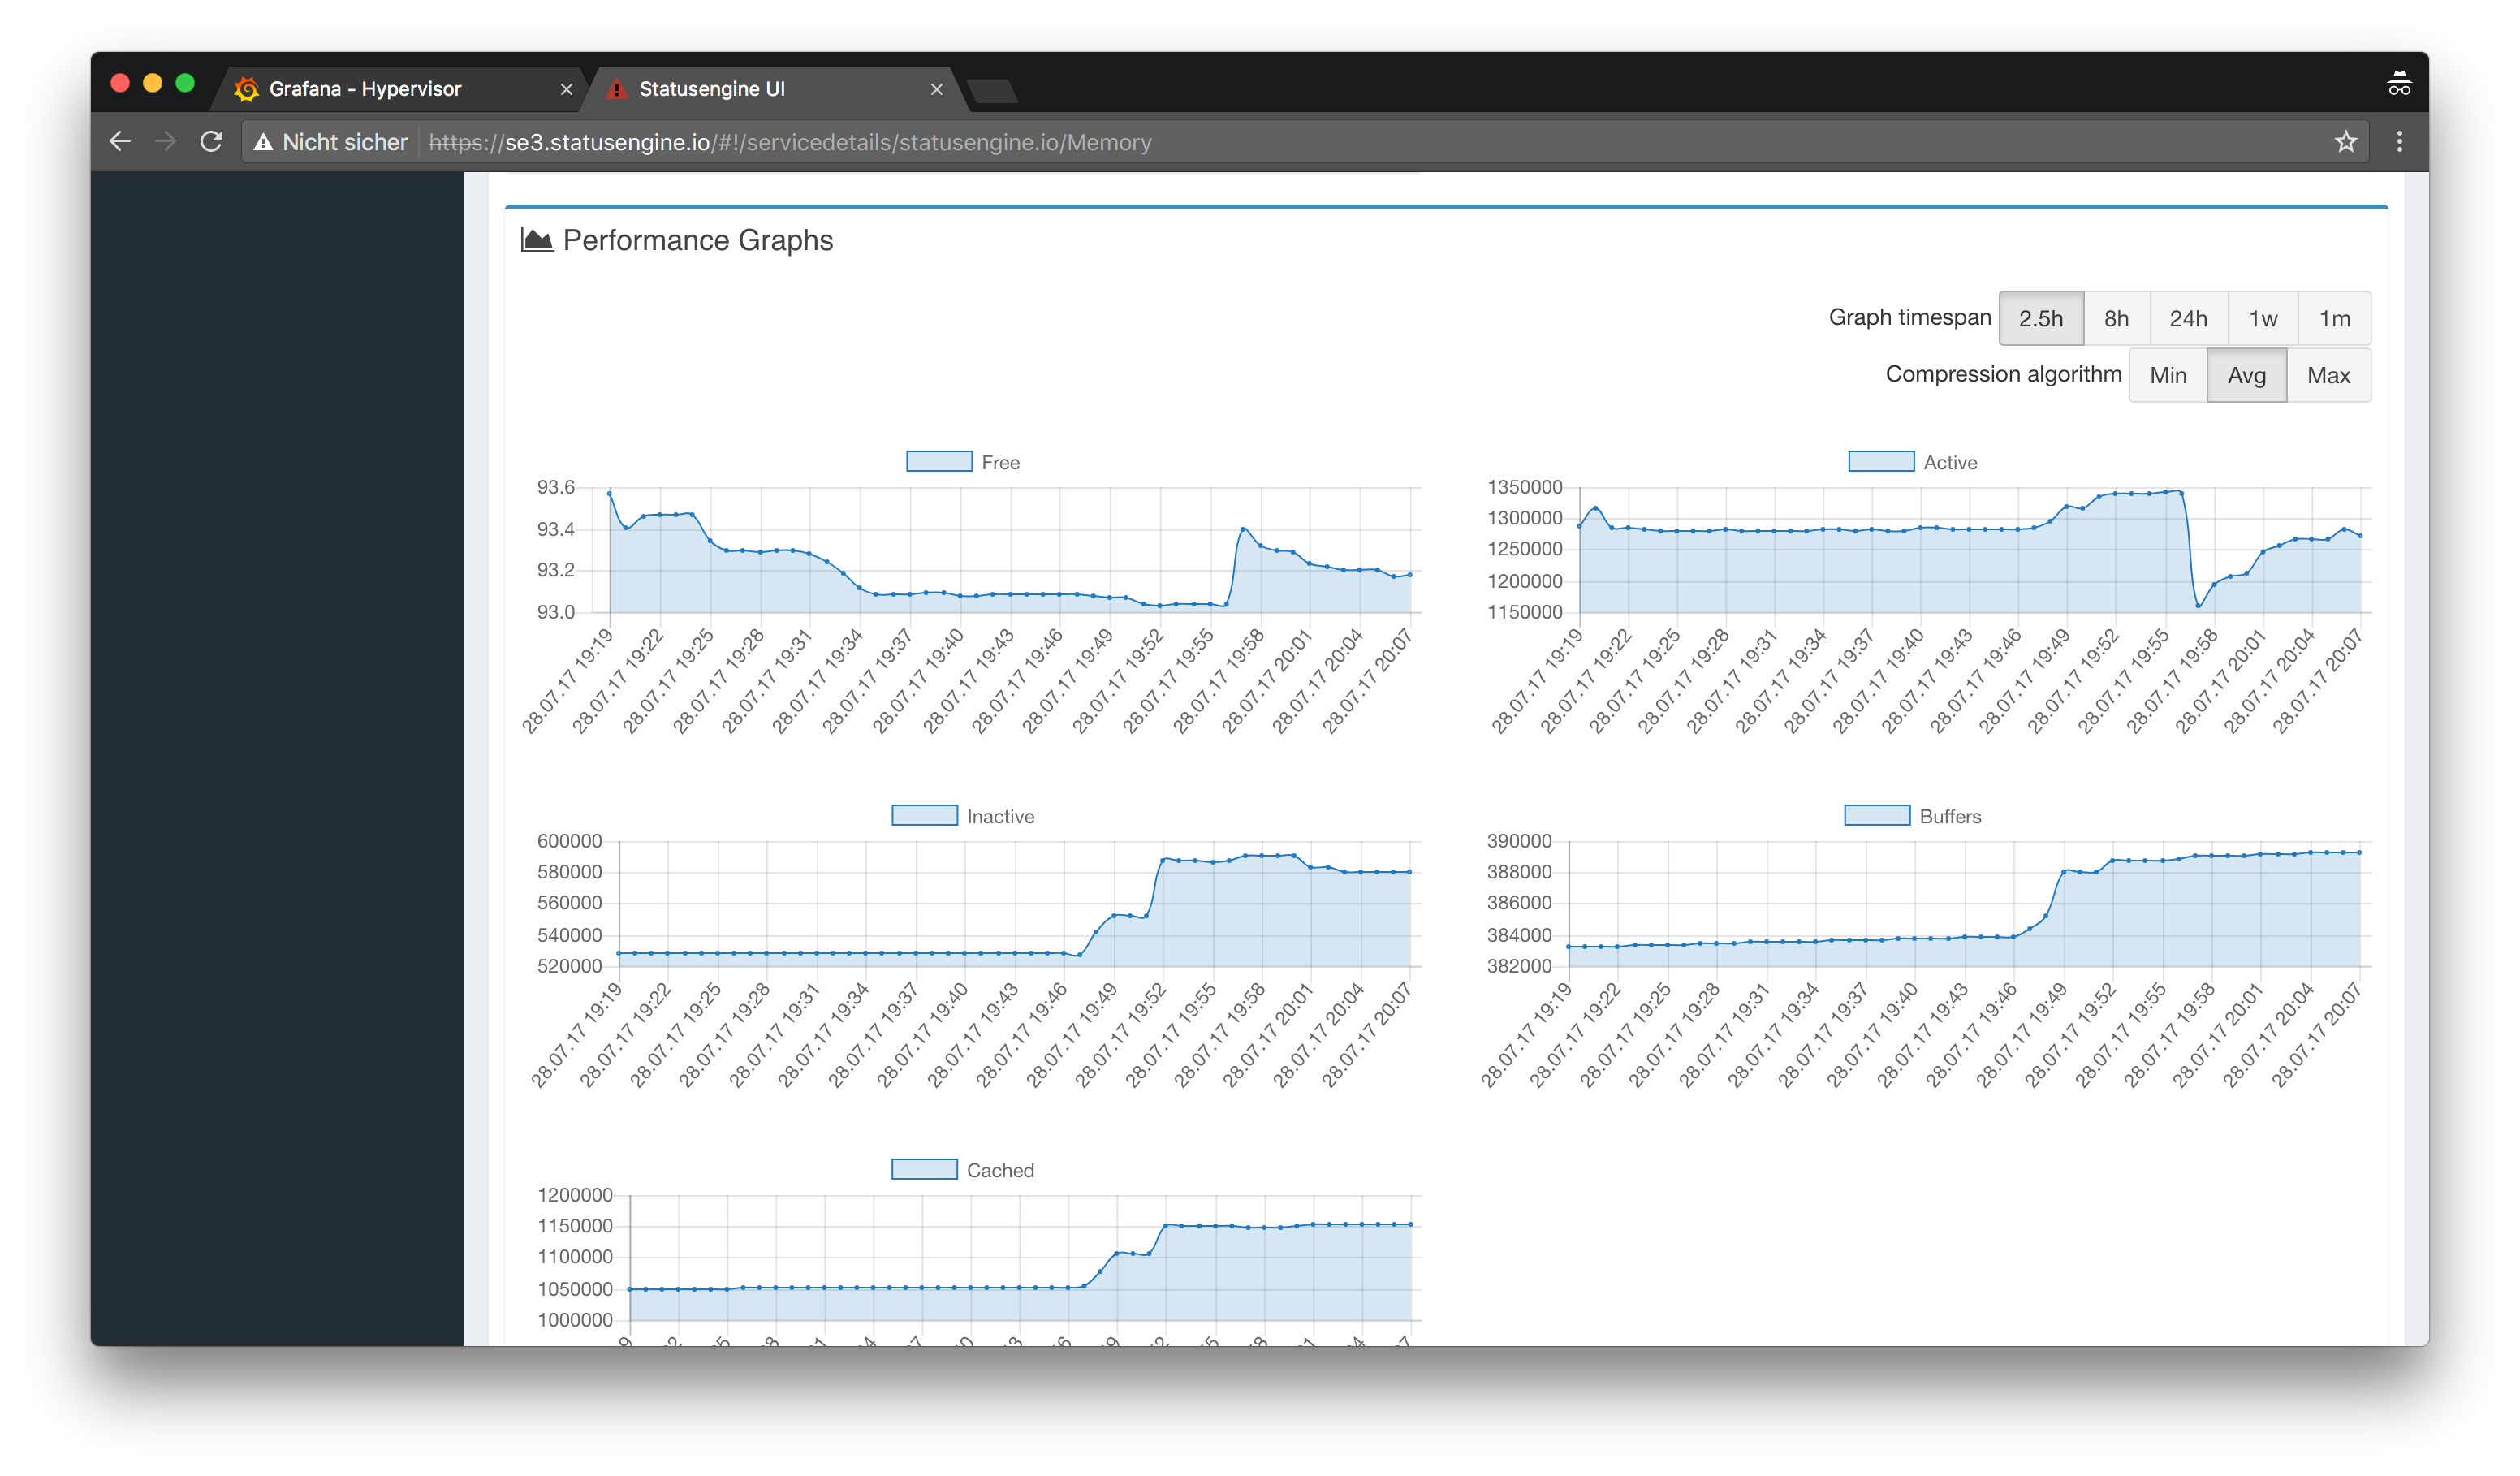
A modern, responsive web interface built with AngularJS. Communicating via a JSON API to be easy extendable, also has simple support to render performance data.
All Statusengine components can be used stand alone or split across multiple nodes.
Requirements
PHP 7 and MySQL 8 ready!
Statusengine is tested on PHP7, MySQL 5 and MySQL 8
- Naemon or Nagios 4
- Redis Server
- MySQL/MariaDB or CrateDB
- Ubuntu 14.04, 16.06 or 18.04
- PHP 7 or greater
All examples in this documentation refer to Ubuntu so maybe things are different on an other distribution.
Quick start
Performance data
Statusengine Worker is able to process performance data, collected by
the monitoring core.
Statusengine Ui provides a basic performance data renderer, to make your data
visible.
Supported Performance Data Storage Backends:
Graphite
Graphite is a well known solution to save performance data. It is also
very well integrated into Grafana - so I would recommend to start with
Graphite.
Read the Guide of how to install Graphite and Grafana for Statusengine.
CrateDB
For CrateDB is also an Datasource plugin for Grafana available.
Advantage: No additional software required, very easy to setup and scalable.
Read the Guide
Elasticsearch
Statusengine is also able to save your performance data to Elasticsearch.
Advantage: No additional software required, very easy to setup and scalable.
Read the Guide for Elasticsearch 5.x
/
Elasticsearch 6.x
/
Elasticsearch 7.x
MySQL
Statusengine is also able to save your performance data to a MySQL database.
This was implemented for demo and testing purpose.
Advantage: No additional software required and very easy to setup.
Disadvantage: For small setups only - may be slow with many data.
Read the Guide
Examples

