Store Nagios or Naemon Performance Data to CrateDB
In this tutorial, we are going to configure your system, to store Nagios and Naemon Performance Data into an CrateDB Cluster.
In addition, I will show you, how to use this data via Statusengine UI and Grafana.
All commands needs to run as user root or via sudo.
Requirements
CrateDB - If you don't have CrateDB installed yet - follow this guide.
Nagios or Naemon with loaded Statusengine Broker Module
Running Statusengine Worker
Recommended
Configure Statusengine Broker Module to export performance data
If not already done, add use_service_perfdata=1 to your Statusengine Broker Module options
and restart your Nagios or Naemon process.
Configure Statusengine Worker to store performance data to CrateDB
Open the file /opt/statusengine/worker/etc/config.yml to adjust the following values
# If Statusengine should save historical data to CrateDB
# WARNING: Do not set use_crate and use_mysql to 1 at the same time!
use_crate: 0

# Configuration of your CrateDB Cluster
# This is an array of cluster nodes.
#
# It is recommended to you a load balancer in front of your CrateDB cluster!
# So you will have a single ip address where Statusengine is going to connect to
crate:
  nodes:
    - 192.168.56.102:4200
#    - 172.0.0.1:4200


############
# PERFDATA DATA CONFIGURATION
############

# If statusengine should process performance data or not
# 1 = yes
# 0 = no
process_perfdata: 1

# Number of worker processes for service check results
# Target: You selected this at 'perfdata_backend' option
number_perfdata_worker: 1

# Uncomment to enable
# You can enable as much backends as you want
perfdata_backend:
 - crate
# - graphite
# - mysql
# - elasticsearch
Even if you set use_crate=0, because you don't want to use CrateDB as Storage Backend for your status data, you can still use it to
store your performance data into it.
The metrics will be exported to the table statusengine_perfdata.
To load the new configuration, you need to restart Statusengine Worker.
systemctl restart statusengine.service
PS: You can enable multiple performance data backends if you want.
Example:
perfdata_backend:
- crate
- graphite
- mysql
- elasticsearch
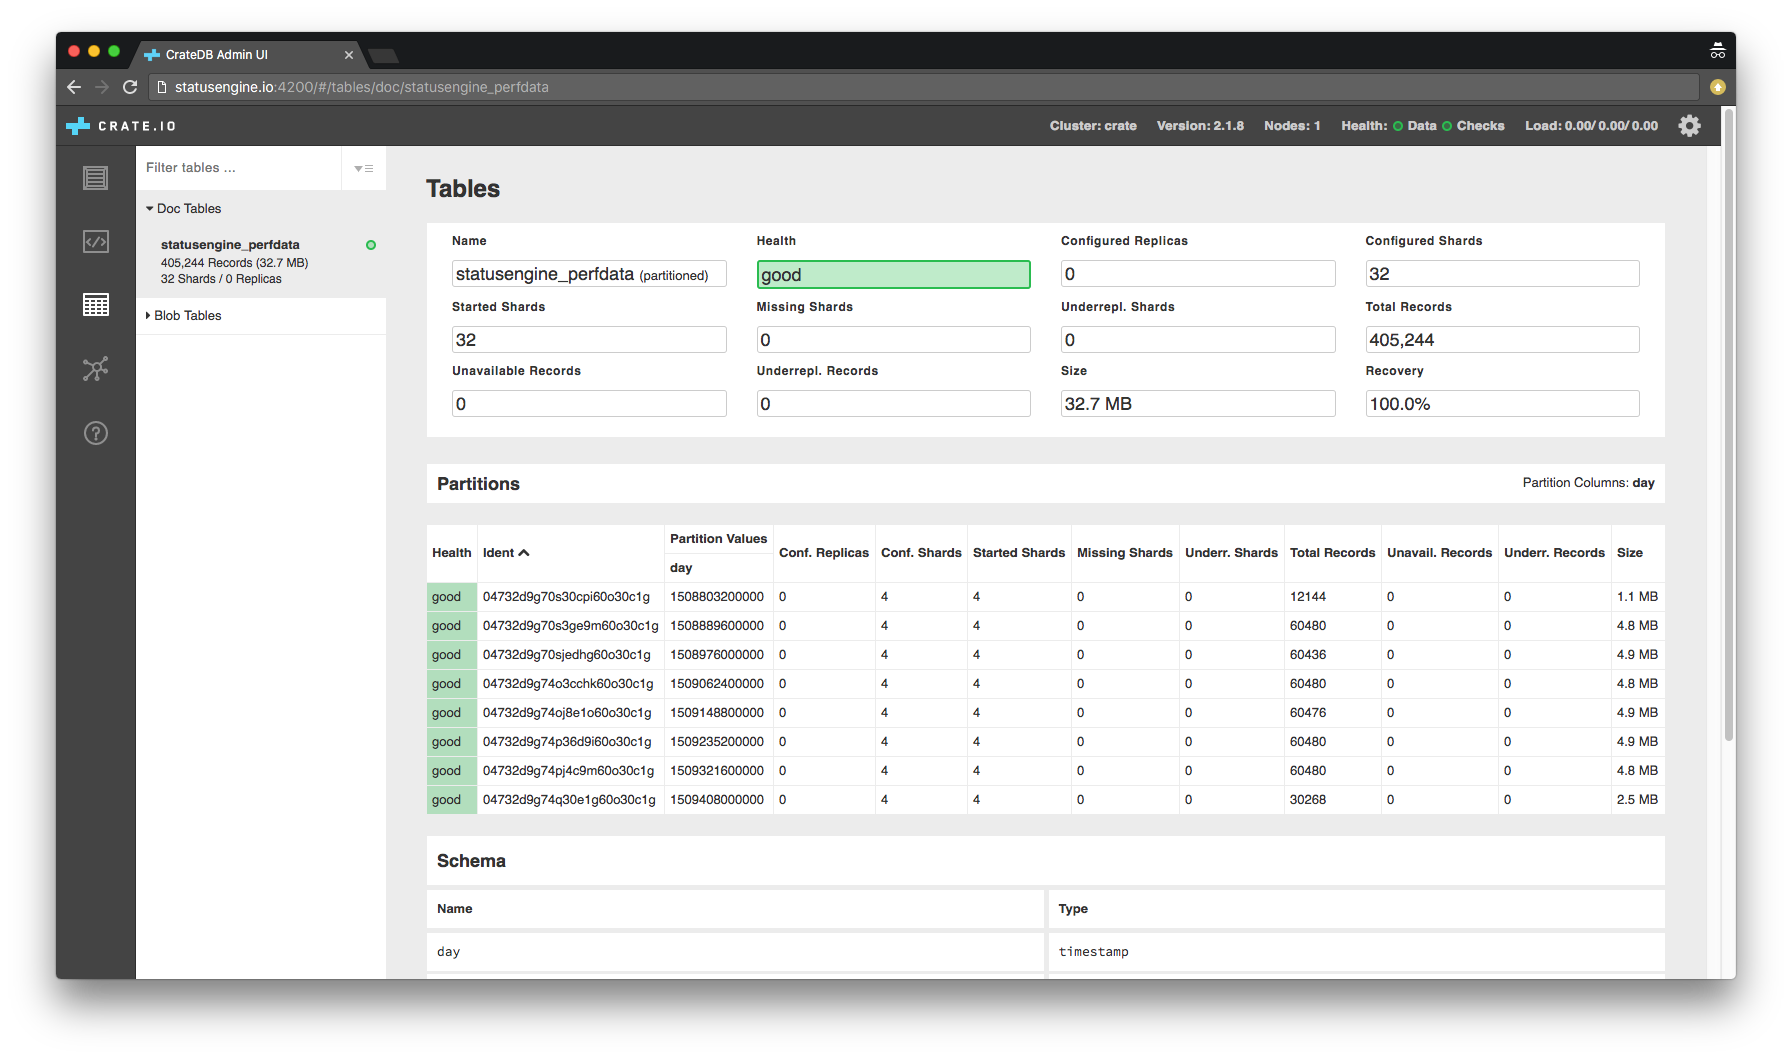
Check Table for Performance Data records
After you restared Statusengine Worker, you should query your database to make sure, that performance data records gets saved to your database.
You can do this via the CrateDB Admin Ui
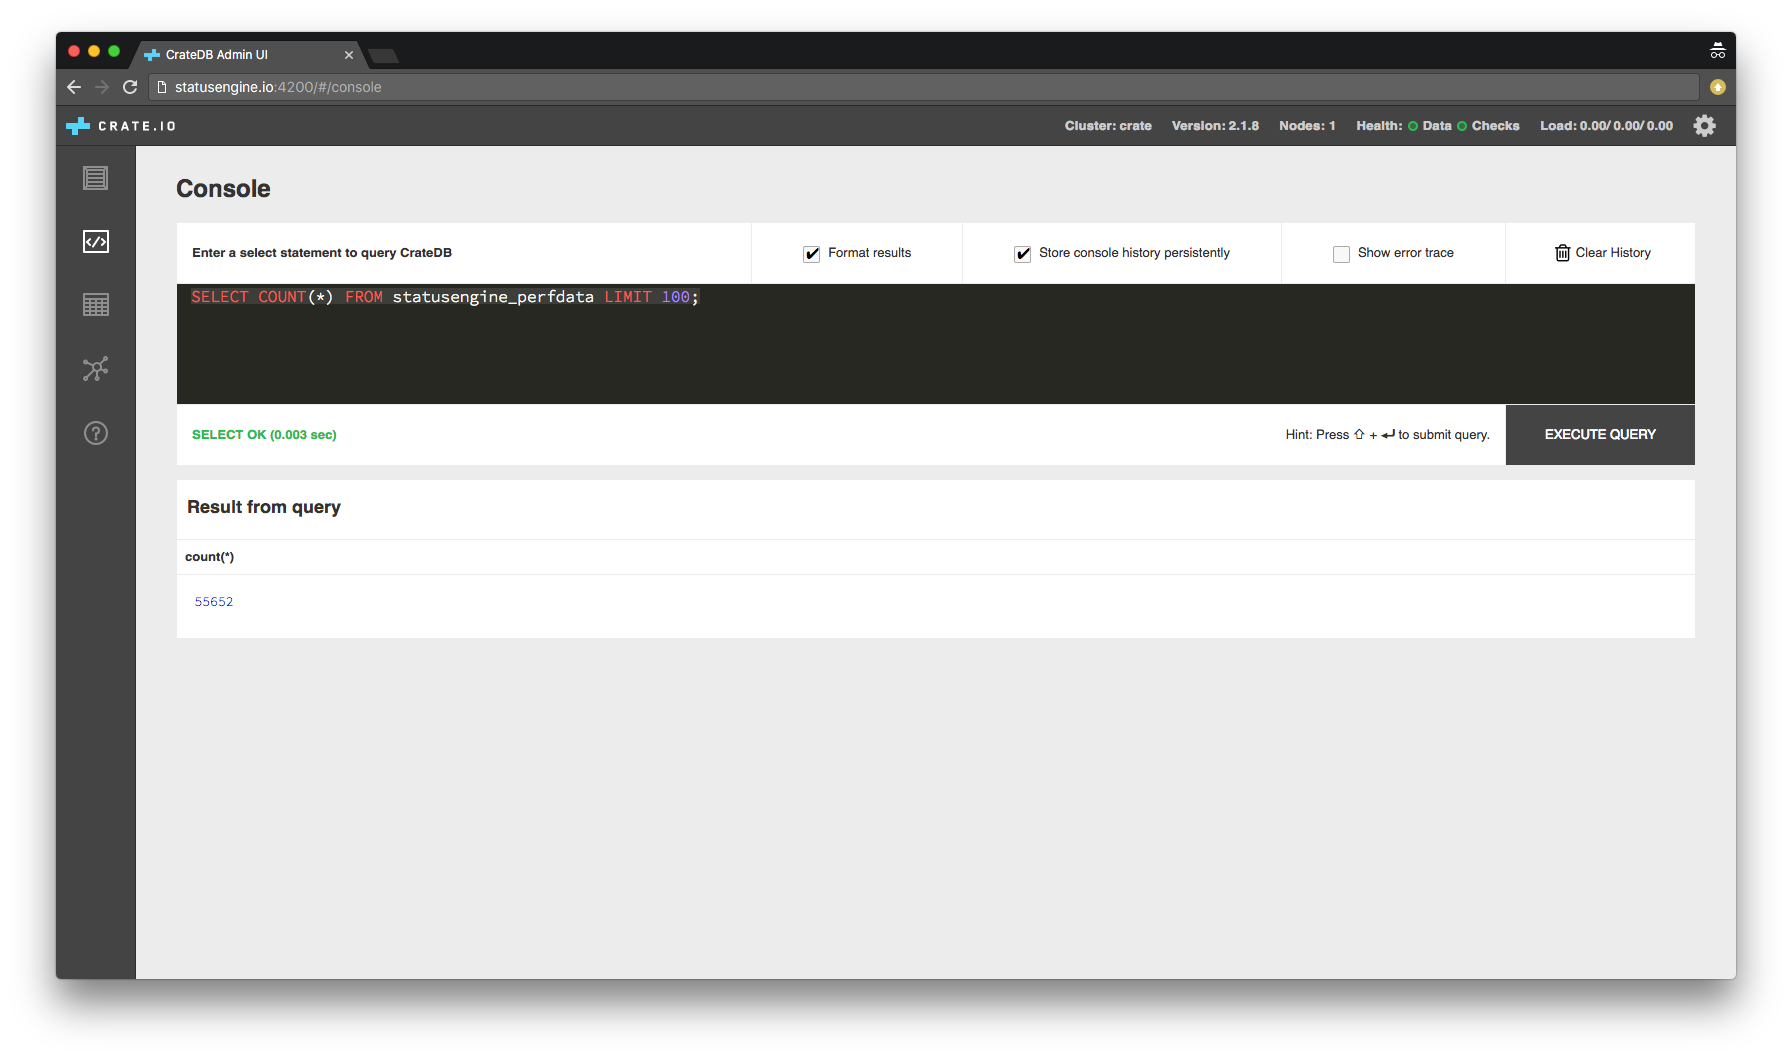
The amount of records you will see, depends on how many checks your system executes and how frequently they get executed.
If your result is zero, you should wait a few minutes before you continue with this guide.
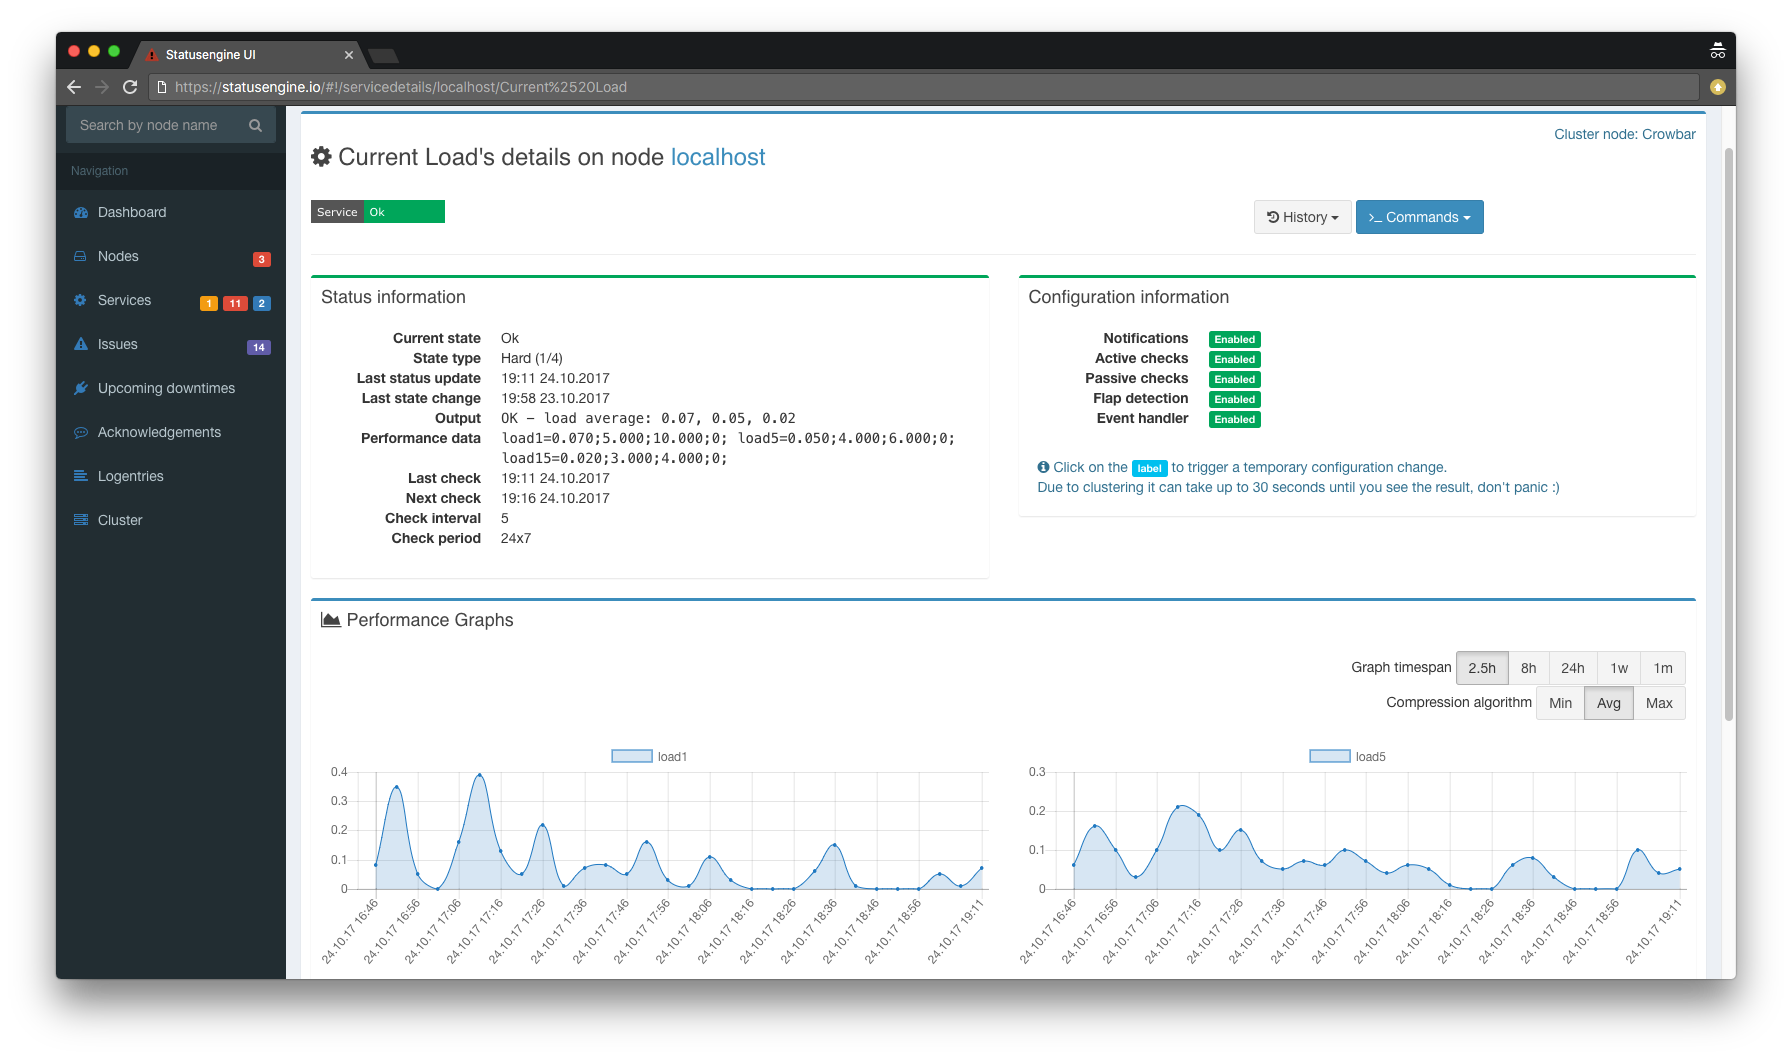
Configure Statusengine Ui
Statusengine Ui is able to render basic performance data, from an CrateDB data source.
Open the file /usr/share/statusengine-ui/etc/config.yml to adjust the following values
# If Statusengine Ui should load status data from CrateDB
# WARNING: Do not set use_crate and use_mysql to 1 at the same time!
use_crate: 1

# Configuration of your CrateDB Cluster
# This is an array of cluster nodes.
#
# It is recommended to you a load balancer in front of your CrateDB cluster!
# So you will have a single ip address where Statusengine is going to connect to
crate:
  nodes:
    - 192.168.56.102:4200
#    - 172.0.0.1:4200


############
# PERFDATA DATA CONFIGURATION
############

# Determine if the Statusengine Ui should use on of the following
# perfdata_backend's to load and display performance data
# 0 disable, 1 enable
display_perfdata: 1

# Uncomment to enable
# CrateDB as Performance Data Backend
# CrateDB is the default at the moment
perfdata_backend: crate

# Graphite as Performance Data Backend
#perfdata_backend: graphite

# MySQL as Performance Data Backend
#perfdata_backend: mysql

# Elasticsearch as Performance Data Backend
#perfdata_backend: elasticsearch
Important! Only one perfdata_backend could be enabled at the same time!
Even if you set use_crate=0, because you don't want to use CrateDB as Storage Backend for your status data, you can still use it to query your performance data.
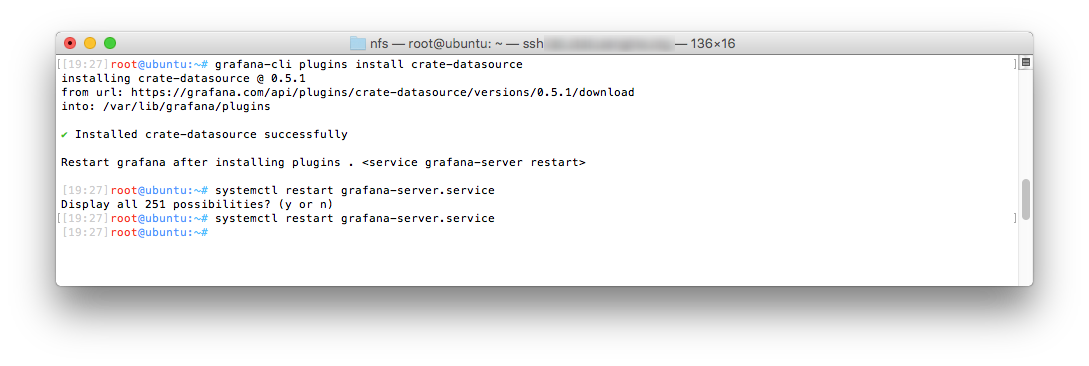
Configure Grafana
Once performance data gets stored to CrateDB, you can also use Grafana to build up own dashboards.
Install Crate Grafana Plugin
First of all, you need to install the Crate Grafana Plugin.
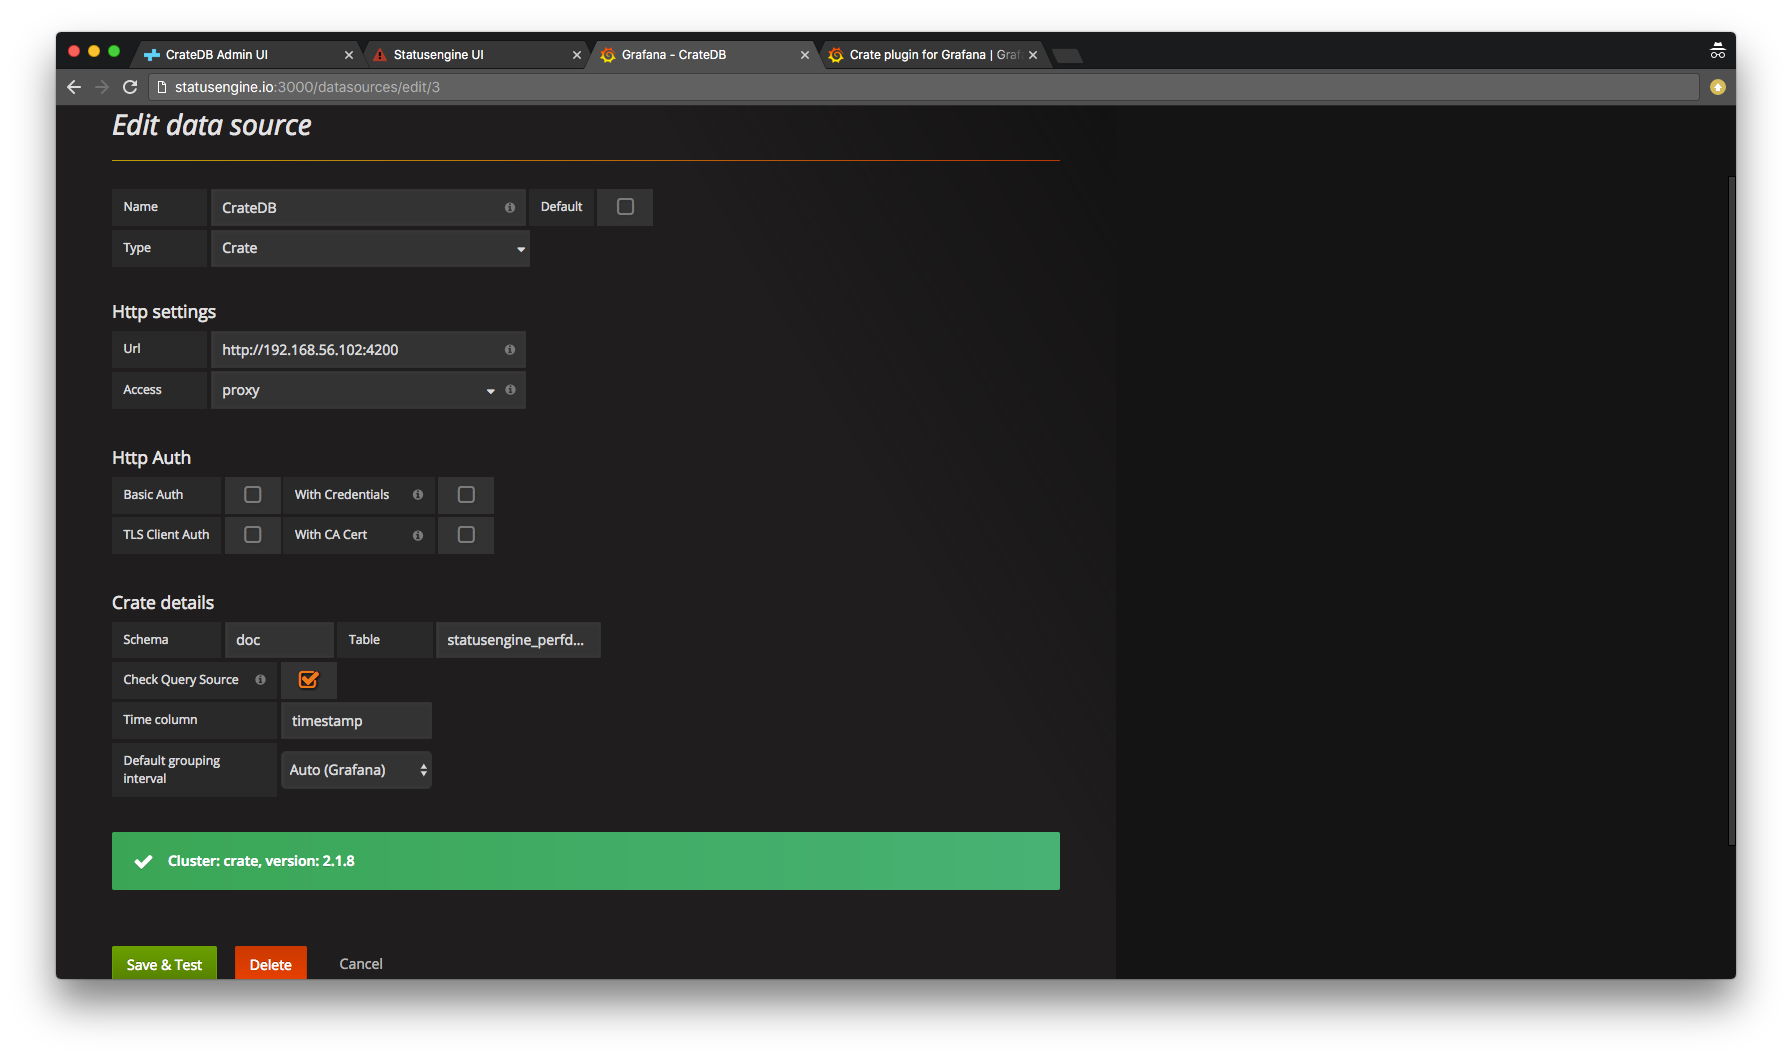
Add Crate data source
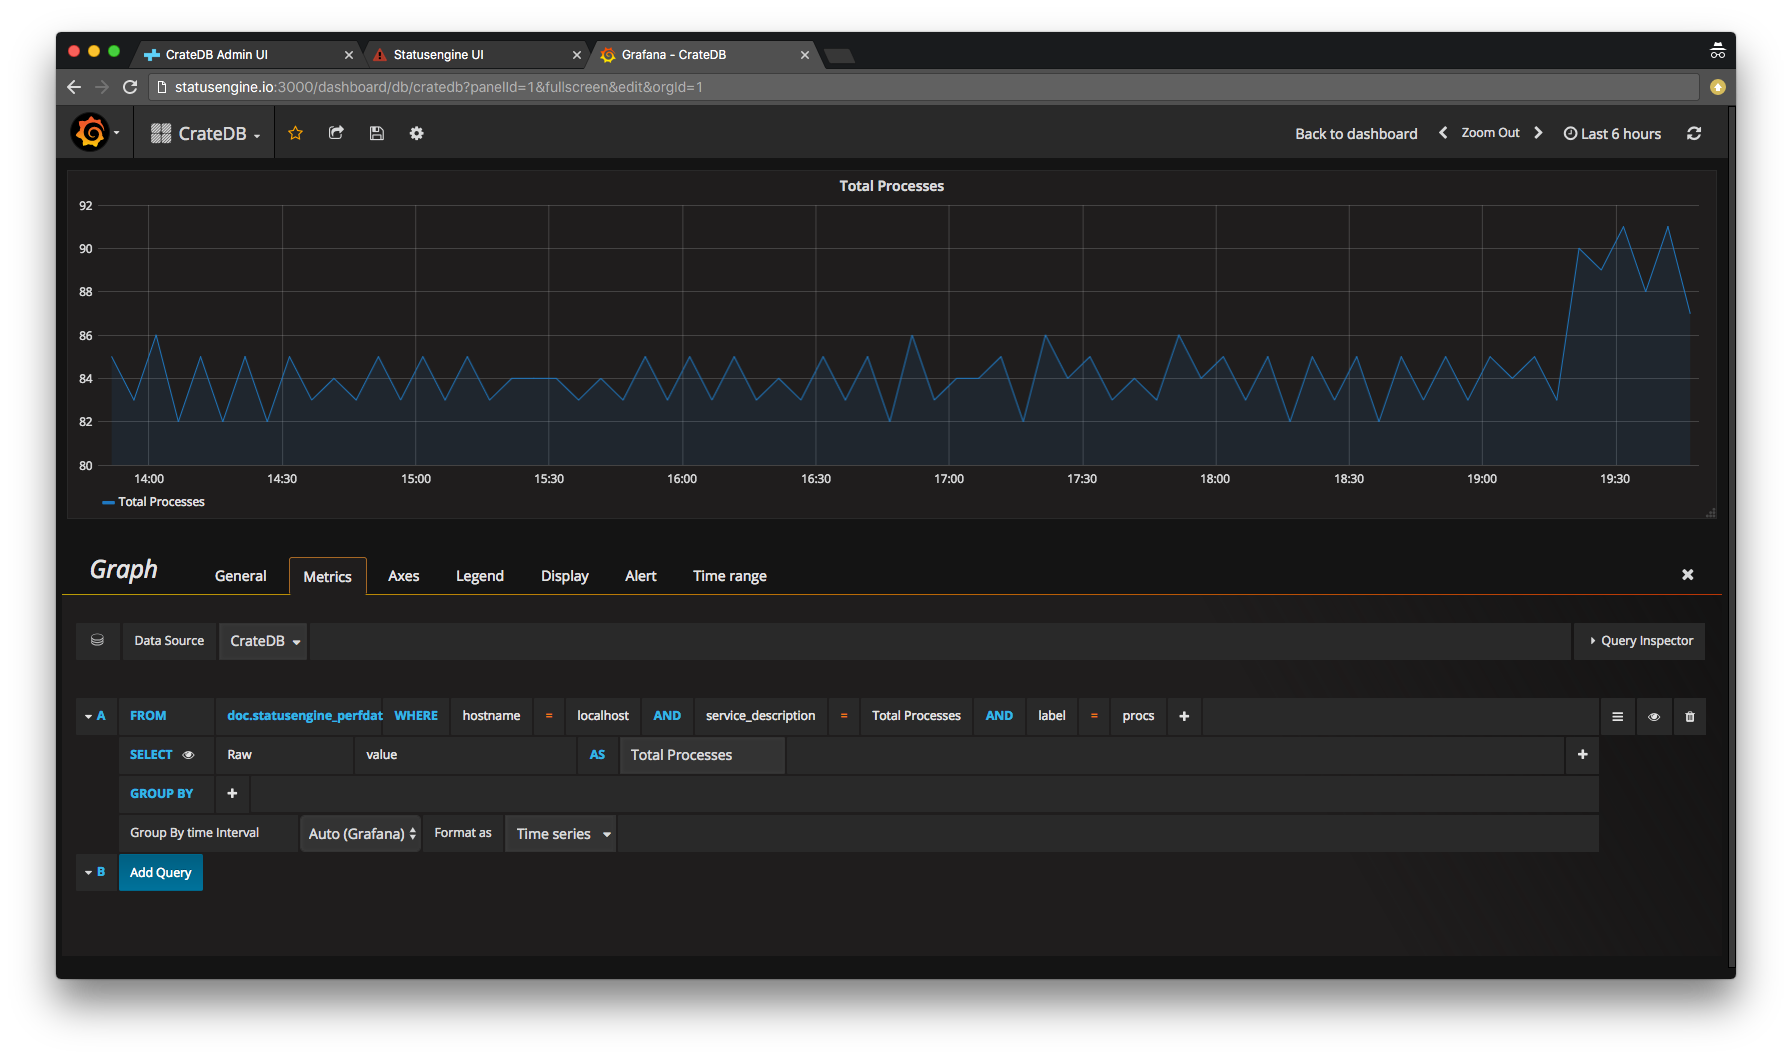
Build your first dashboard
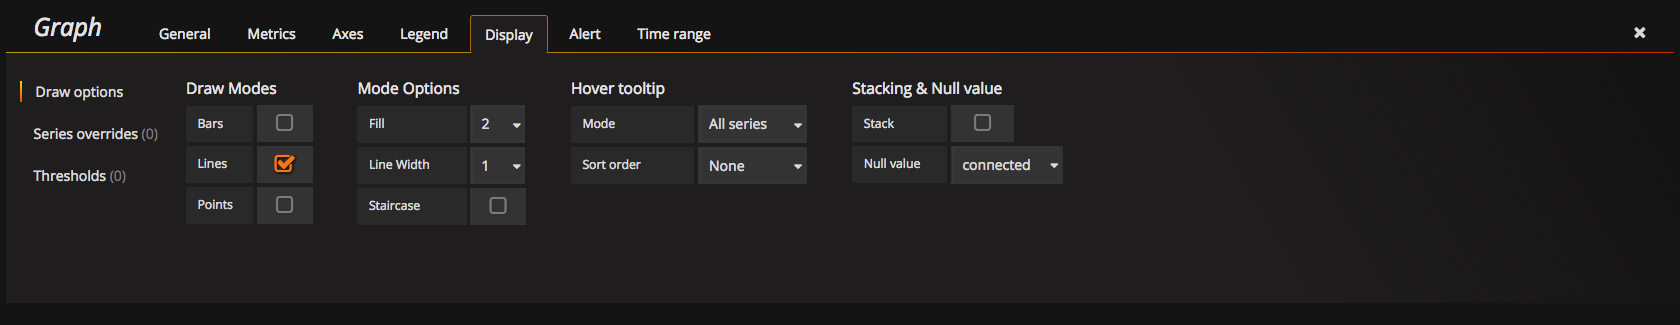
Make sure, that you set Display Null value connected
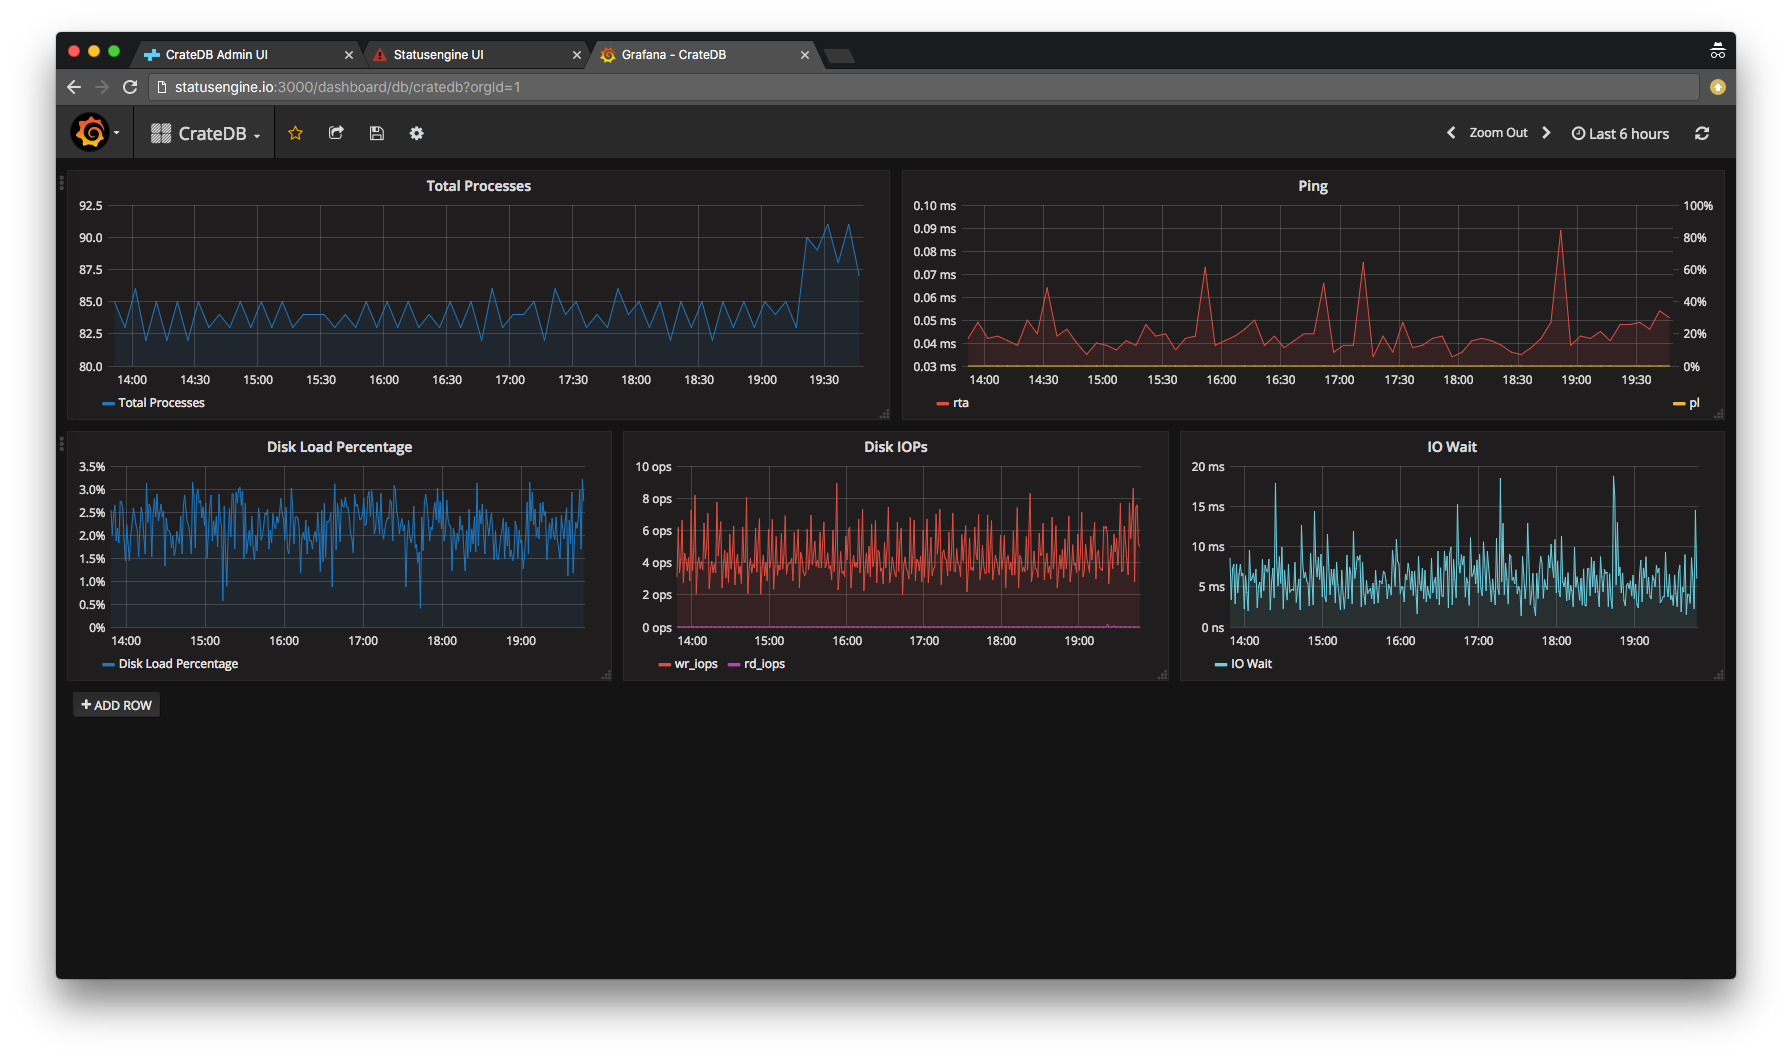
Play around
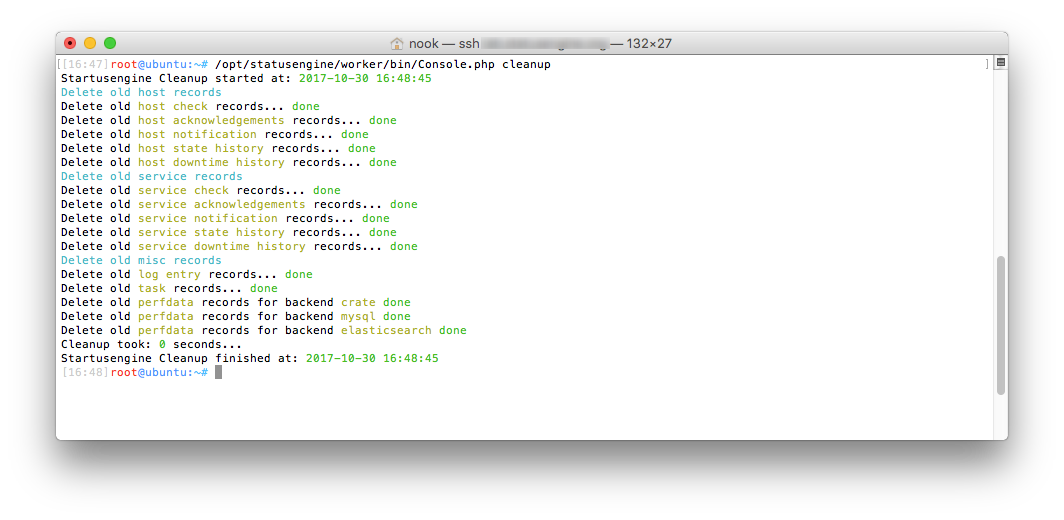
Deletion of old records
By default, CrateDB will create a new Partition in the table statusengine_perfdata for every day.
This behavior is set in the default sql schema:
CREATE TABLE statusengine_perfdata (
    ...
) CLUSTERED INTO 4 SHARDS PARTITIONED BY (DAY) WITH (number_of_replicas = '0');
The Statusengine Cleanup Cronjob will delete partitions, that are older than age_perfdata. age_perfdata is set in days.