Store Nagios or Naemon Performance Data to Elasticsearch 5.x
Related topics:
- Store Nagios or Naemon Performance Data to Elasticsearch 5.x
- Store Nagios or Naemon Performance Data to Elasticsearch 6.x
- Store Nagios or Naemon Performance Data to Elasticsearch 7.x
In this tutorial, we are going to configure your system, to store Nagios and Naemon Performance Data into an Elasticsearch Cluster.
In addition, I will show you, how to use this data via Statusengine UI and Grafana.
All commands needs to run as user root or via sudo.
Requirements
Elasticsearch 5.x - If you don't have Elasticsearch installed yet - follow this guide.
Nagios or Naemon with loaded Statusengine Broker Module
Running Statusengine Worker
Recommended
- Statusengine UI
- Grafana (You can skip the Graphite part.)
Install PHP Elasticsearch library
Why I have to do this by myself?
The PHP library for Elasticsearch will require at least PHP 5.6.6 which is not included in all distributions.
I don't want to lock out users on older PHP versions, which are not plan to use Elasticsearch at all.
To install the library, you need PHP Composer.
apt-get install php-curl php-json php-mbstring
cd /opt/statusengine/worker
composer require elasticsearch/elasticsearch:~5.0
Configure Statusengine Broker Module to export performance data
If not already done, add use_service_perfdata=1 to your Statusengine Broker Module options
and restart your Nagios or Naemon process.
Configure Statusengine Worker to store performance data to Elasticsearch
Open the file /opt/statusengine/worker/etc/config.yml to adjust the following values
# Uncomment to enable
# You can enable as much backends as you want
perfdata_backend:
# - crate
# - graphite
# - mysql
- elasticsearch

############
# ELASTICSEARCH CONFIGURATION
############

# Statusengine will create an index template to store performance data to
# Elasticsearch.
# The template is hardcoded and will be managed by Statusengine
# automatically. How ever, you can still change
# important settings.
# If you change any template settings, you need to do this
# BEFORE THE FIRST start of Statusengine Worker,
# or you need to delete/edit the old template manually via Elasticsearch API
elasticsearch_template:
  name: statusengine-metric
  number_of_shards: 2
  number_of_replicas: 0
  refresh_interval: 15s
  codec: best_compression
  enable_all: 0
  enable_source: 1

# Index that will be used to store data in Elasticsearch
elasticsearch_index: statusengine-metric-

# The value of elasticsearch_pattern will be added to the end of your
# defiend elasticsearch_index. It is recommended to terminate
# your elasticsearch_index with an dash, like the example
# index: statusengine-metric-
#
# Available patterns:
# - none     => All data in one index, this will also disable deletion of old records!
# - daily    => statusengine-metric-YYYY.MM.DD
# - weekly   => statusengine-metric-GGGG.WW
# - monthly  => statusengine-metric-YYYY.MM
elasticsearch_pattern: daily

# Set the ip address or hostname for your Elasticsearch system or cluster
# Statusengine will use the HTTP API
elasticsearch_address: 127.0.0.1

# Port where your Elasticsearch server is listening to
elasticsearch_port: 9200
With the default configuration, Statusengine Worker will connect to 127.0.0.1:9200, so your Elasticsearch instance need to run on the same Node, as Statusengine Worker is running.
In addition, Statusengine will create an new Index for every day. You can change this behavior by change the elasticsearch_pattern.
To load the new configuration, you need to restart Statusengine Worker.
systemctl restart statusengine.service
PS: You can enable multiple performance data backends if you want.
Example:
perfdata_backend:
- crate
- graphite
# - mysql
- elasticsearch
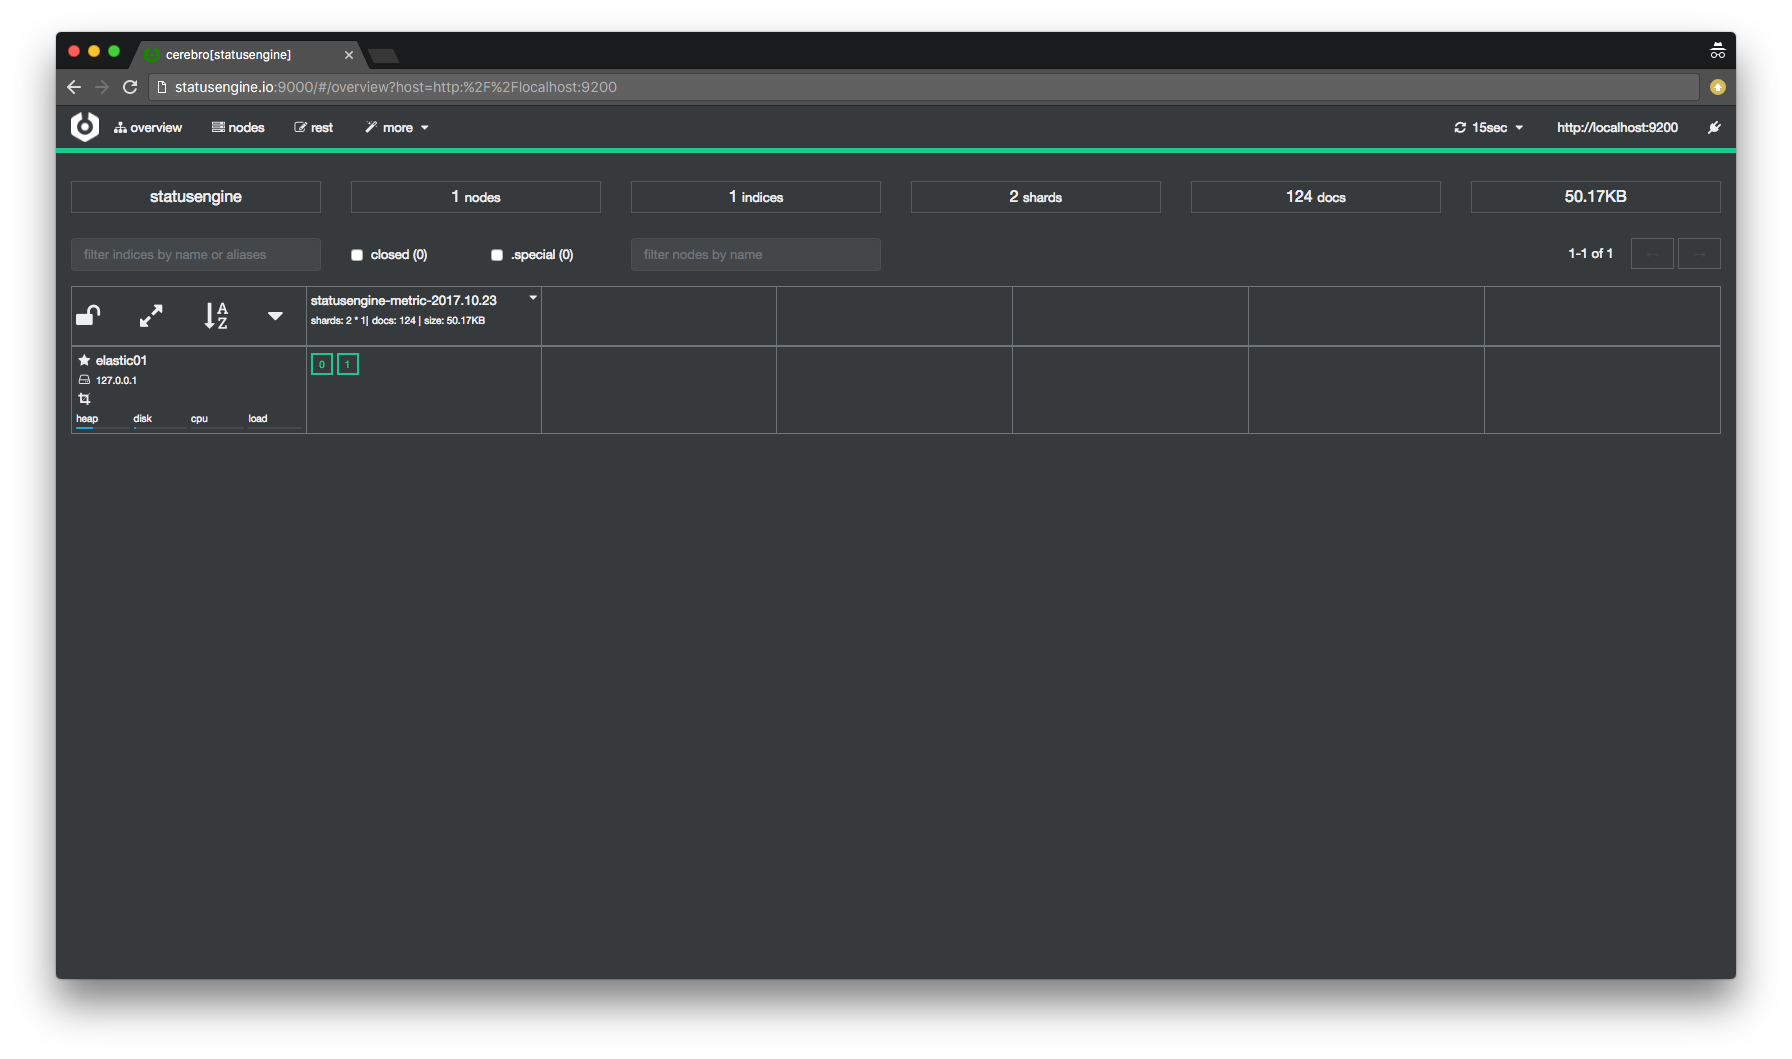
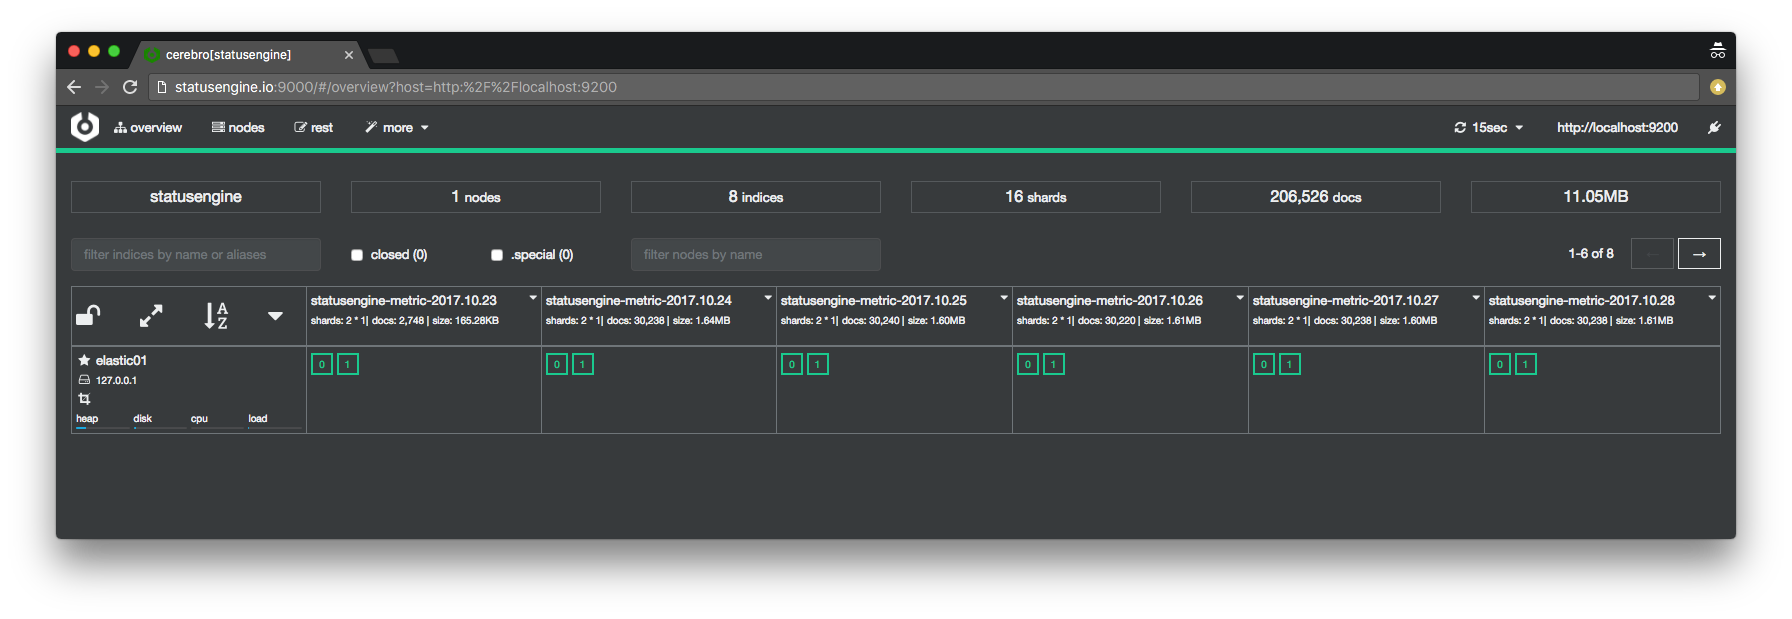
Check Elasticsearch indices via Cerebro
With the first data written to Elasticsearch, Statusengine will create an new Index.
How frequently Statusengine will create an new index, depends on your elasticsearch_pattern.
You can use Cerebro to check if the index was created:
Configure Statusengine Ui
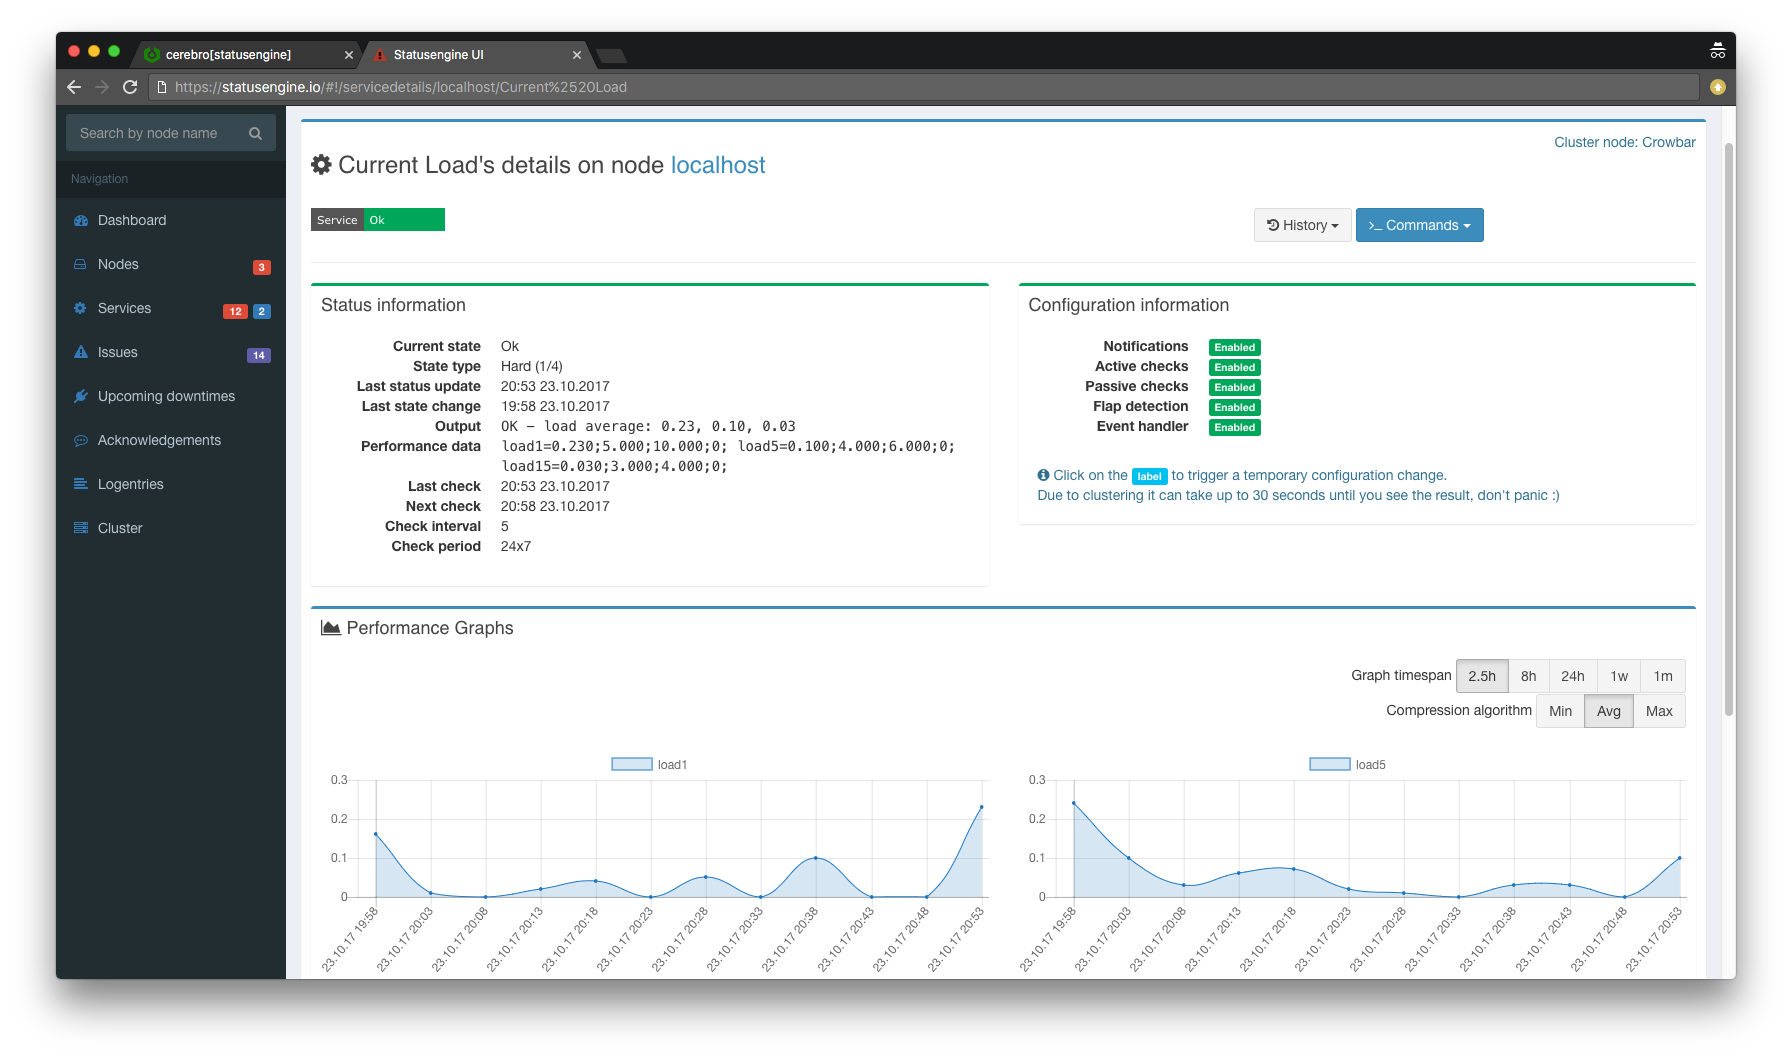
Statusengine Ui is able to render basic performance data, from an Elasticsearch data source.
First of all, you need to install the PHP Elasticsearch library:
apt-get install php-curl php-json php-mbstring
cd /usr/share/statusengine-ui
composer require elasticsearch/elasticsearch:~5.0
Open the file /usr/share/statusengine-ui/etc/config.yml to adjust the following values
# Determine if the Statusengine Ui should use on of the following
# perfdata_backend's to load and display performance data
# 0 disable, 1 enable
display_perfdata: 1

# Uncomment to enable
# CrateDB as Performance Data Backend
# CrateDB is the default at the moment
#perfdata_backend: crate

# Graphite as Performance Data Backend
#perfdata_backend: graphite

# MySQL as Performance Data Backend
#perfdata_backend: mysql

# Elasticsearch as Performance Data Backend
perfdata_backend: elasticsearch


############
# ELASTICSEARCH CONFIGURATION
############

# Index that will be used to store data in Elasticsearch
elasticsearch_index: statusengine-metric-

# The value of elasticsearch_pattern will be added to the end of your
# defiend elasticsearch_index. It is recommended to terminate
# your elasticsearch_index with an dash, like the example
# index: statusengine-metric-
#
# Available patterns:
# - none     => All data in one index, this will also disable deletion of old records!
# - daily    => statusengine-metric-YYYY.MM.DD
# - weekly   => statusengine-metric-GGGG.WW
# - monthly  => statusengine-metric-YYYY.MM
# It is important, that you pick the same pattern, as you use for Statusengine Worker!
elasticsearch_pattern: daily

# Set the ip address or hostname for your Elasticsearch system or cluster
# Statusengine will use the HTTP API
elasticsearch_address: 127.0.0.1

# Port where your Elasticsearch server is listening to
elasticsearch_port: 9200
Important! Only one perfdata_backend could be enabled at the same time!
Also make sure, to use the same elasticsearch_pattern for Statusengine Ui, as you use for Statusengine Worker!
Configure Grafana
Once performance data gets stored to Elasticsearch, you can also use Grafana to build up own dashboards.
Add Elasticsearch data source
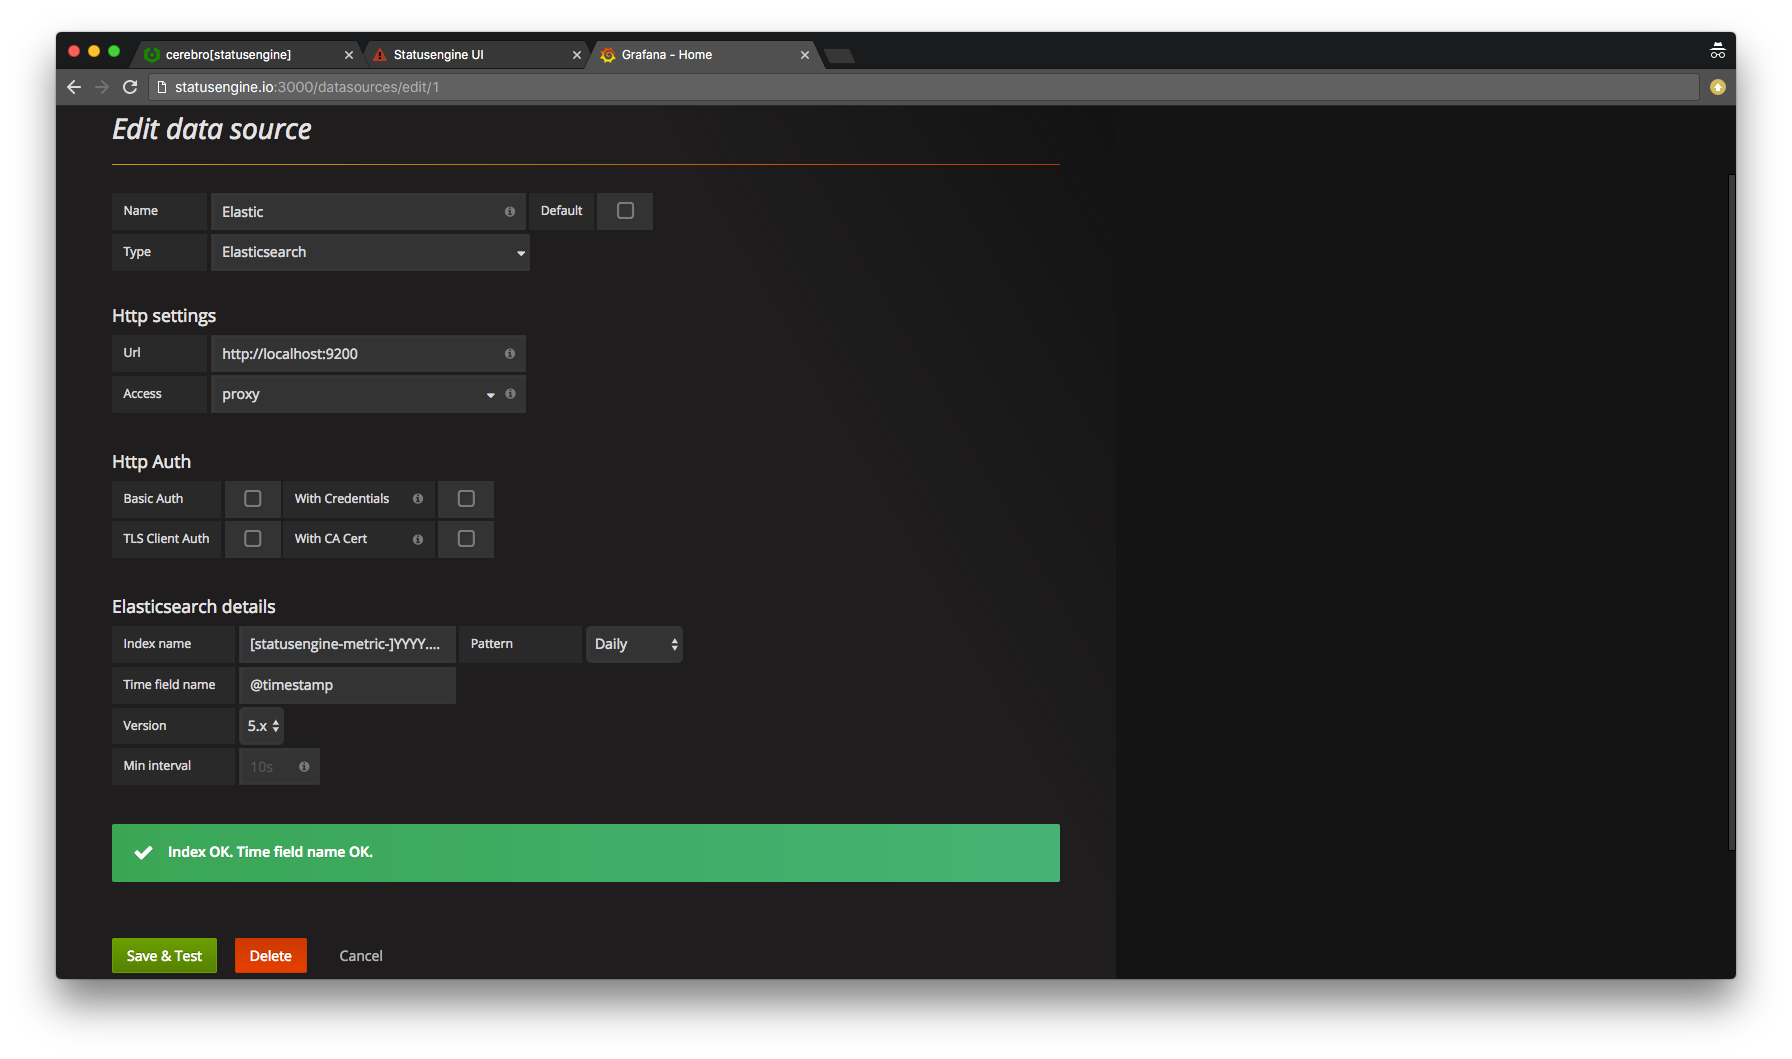
Notice: If you have a pattern, like "daily", the index name in Grafana will look like this: [statusengine-metric-]YYYY.MM.DD
Build your first dashboard
Every query will follow this schema:
hostname:"$HOSTNAME$" AND service_description:"$SERVICEDESCRIPTION$" AND metric:"$METRIC$"
Example:
hostname:"localhost" AND service_description:"Total Processes" AND metric:"procs"
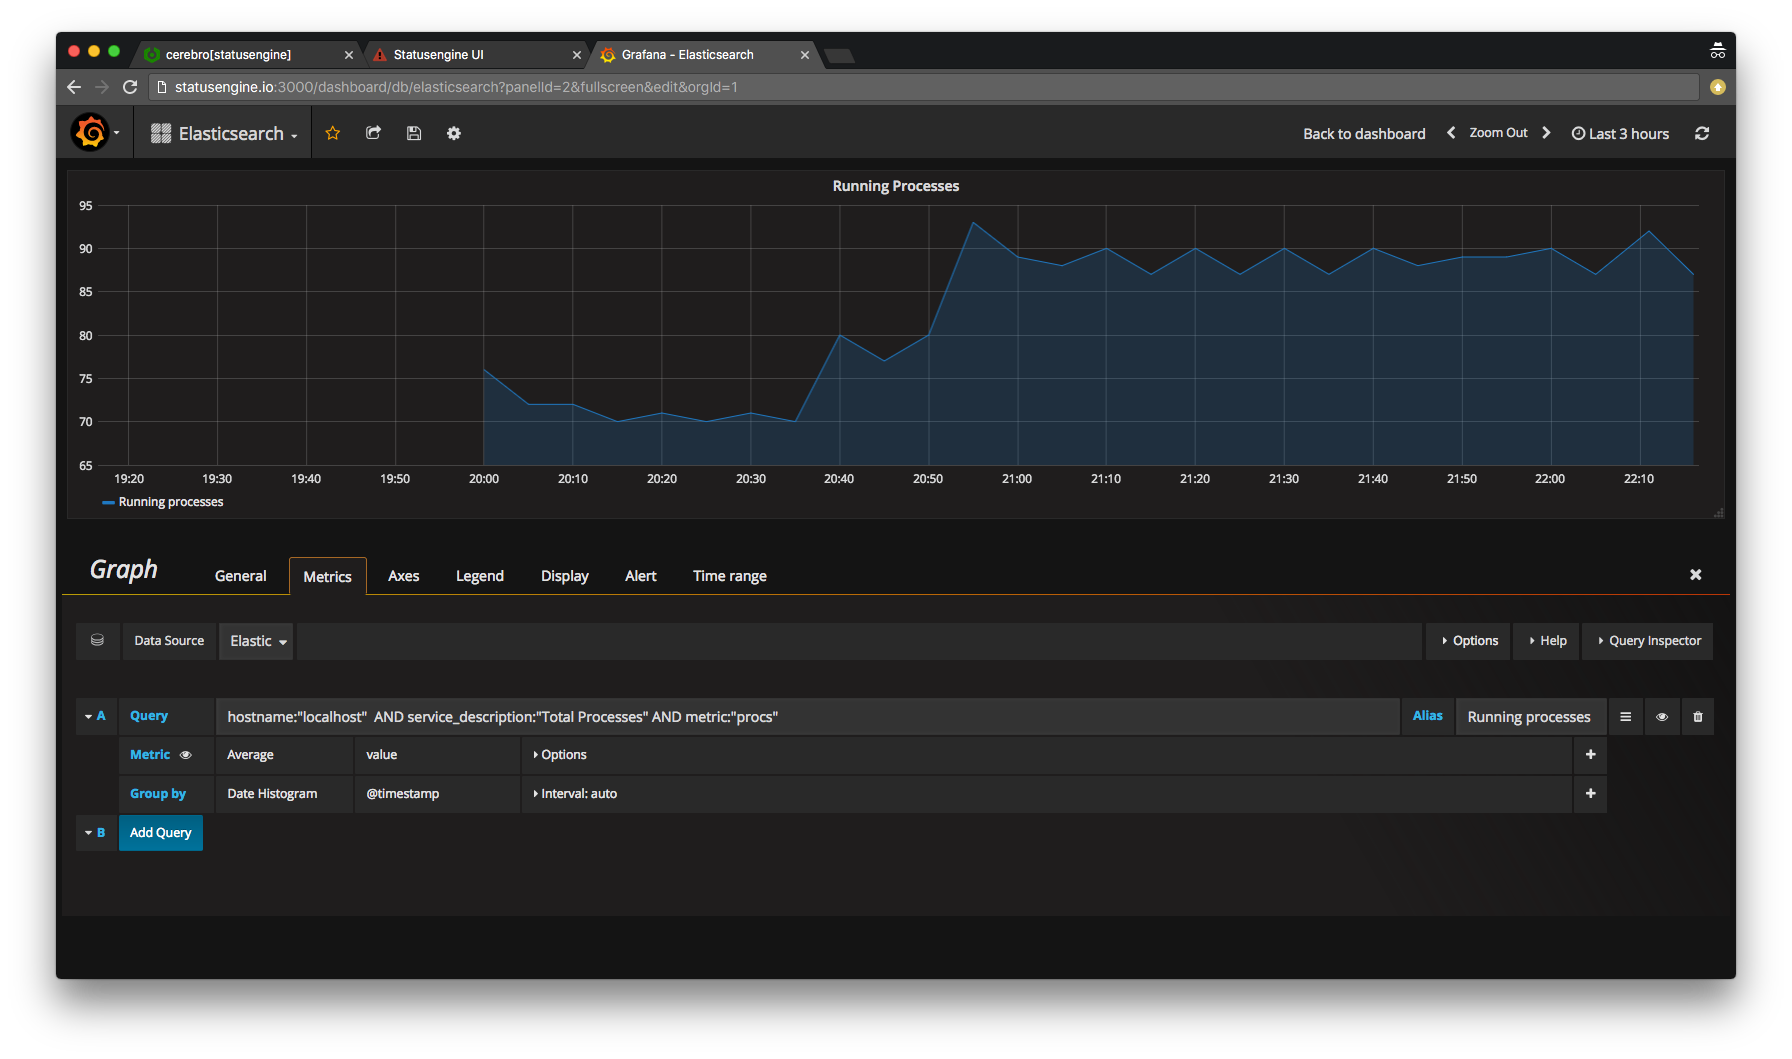
Make sure, that you set Display Null value connected

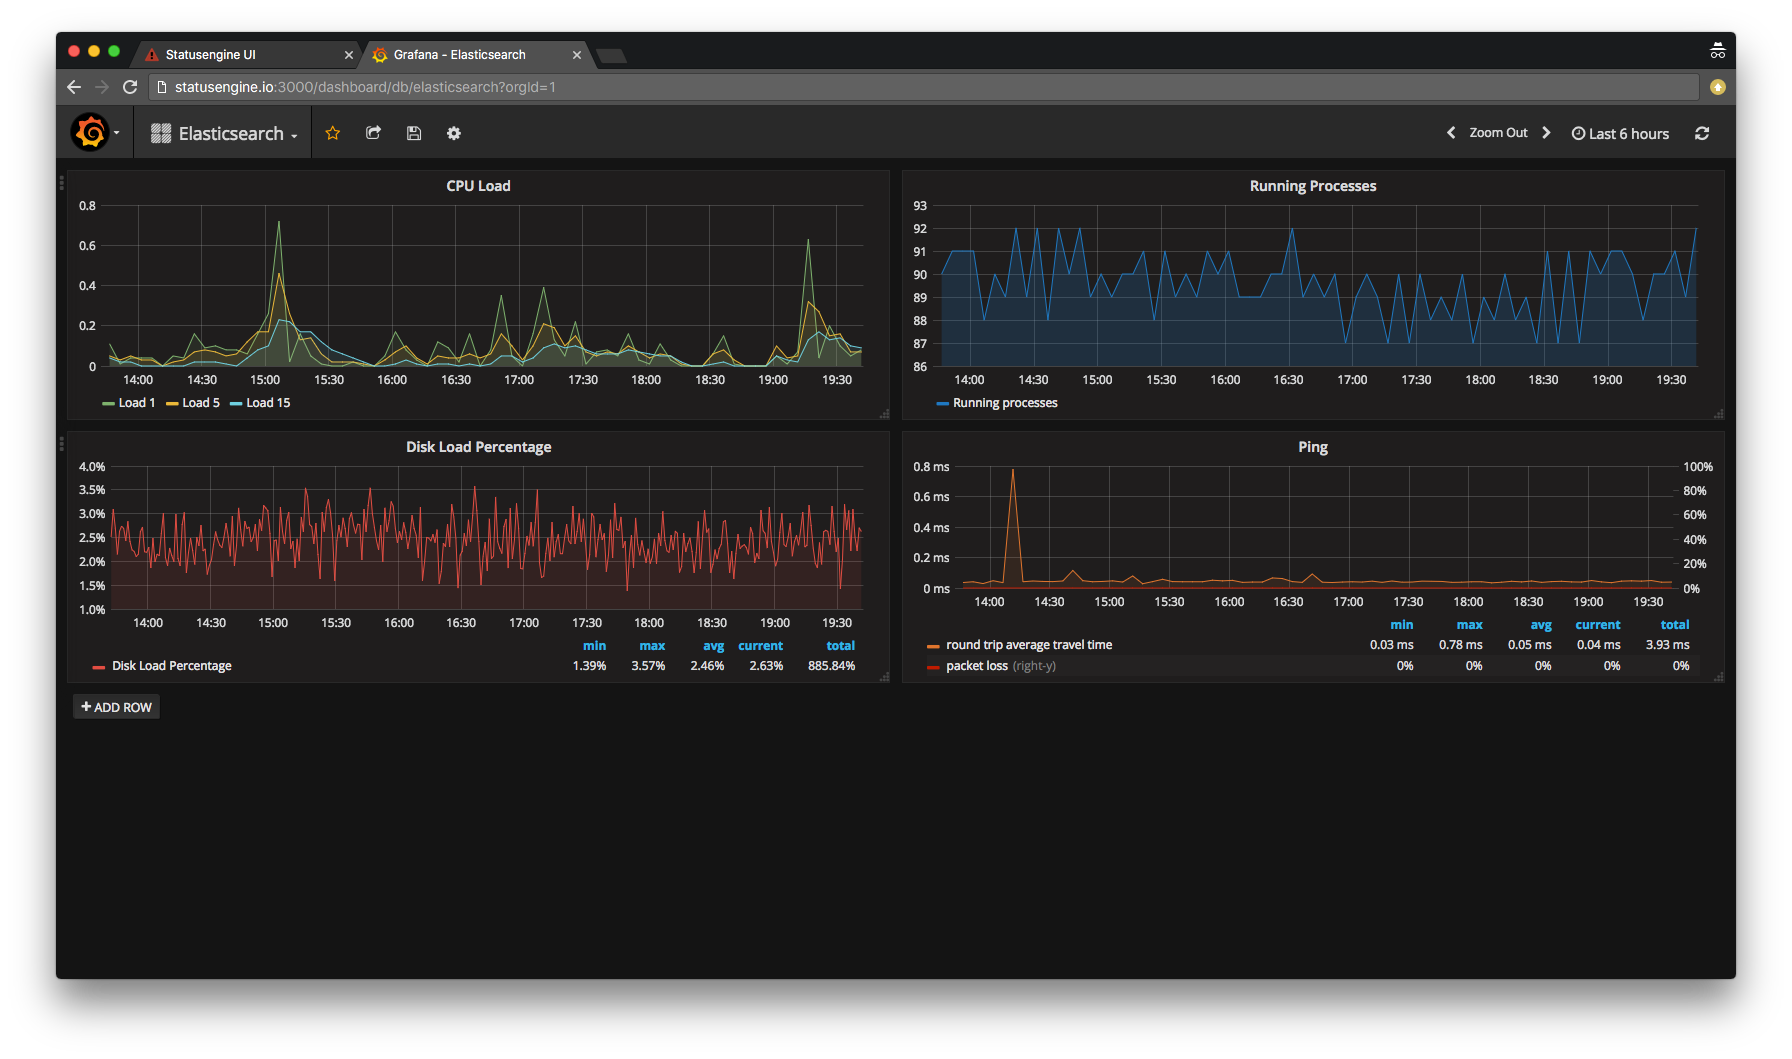
Play around
Deletion of old records
Depending on your elasticsearch_pattern, Statusengine Worker will create multiple indices. In this case, one index per day:
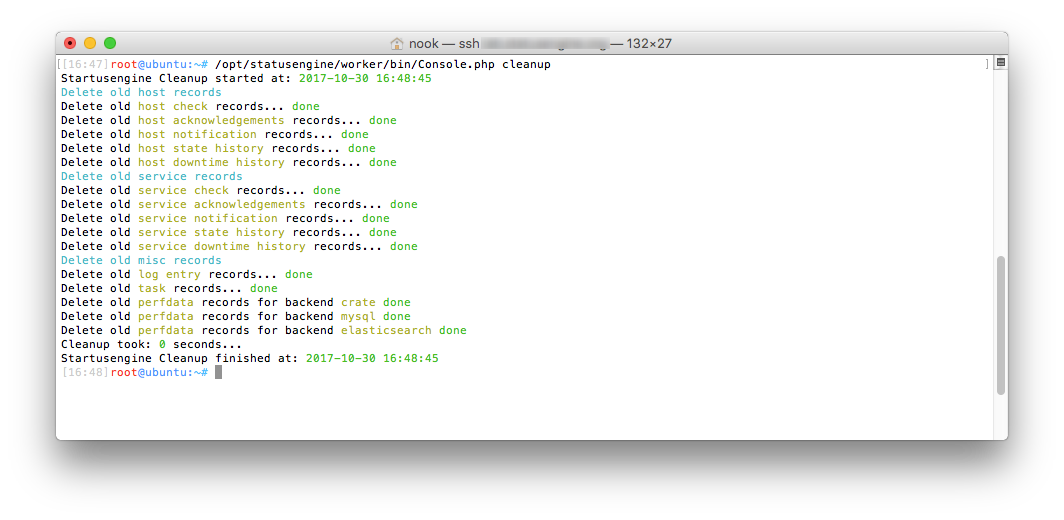
The Statusengine Cleanup Cronjob will delete indices, that are older than age_perfdata. age_perfdata is set in days.
